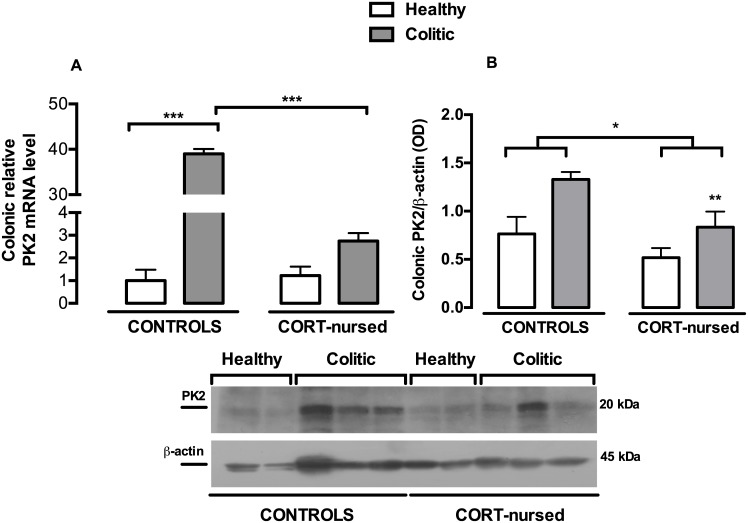
Fig 5. Effects of TNBS-induced colitis on colonic PK2 mRNA and protein expression.
(A) Four days after TNBS instillation, an increase in colonic PK2 mRNA expression was found in control colitic rats (Fisher’s LSD post-hoc, ***p<0.001 vs. control healthy rats). A reduction in PK2 mRNA levels was observed in CORT-nursed colitic animals (Fisher’s LSD post-hoc, ***p<0.001 vs. control colitic rats). The colonic relative mRNA expression levels are expressed in relation to β-actin and presented as fold increase relative to control rats. (B) Western blot analysis showed an increase in PK2 in colitic rats (**p<0.01colitic vs. healthy group). A reduction in PK2 was observed in CORT-nursed rats (*p<0.05 CORT-nursed vs. control group). Results are expressed as the ratio of the optical density (OD) of the PK2 and the β-actin band. (control healthy n = 4, control colitic n = 5, CORT-nursed healthy n = 4, CORT-nursed colitic n = 4). A representative western blot image is shown.

