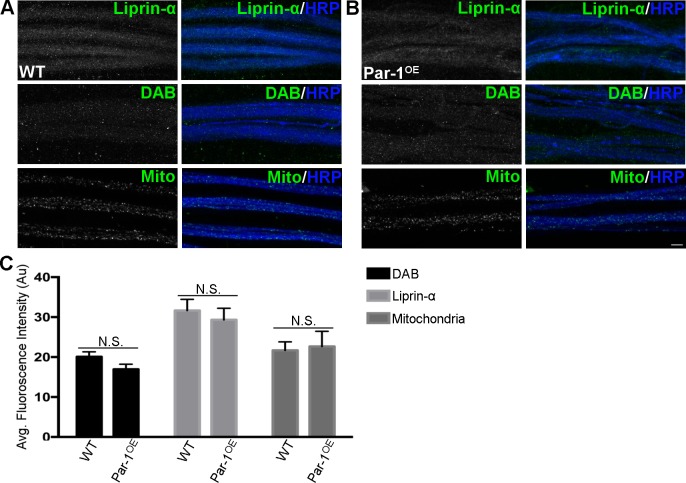
Fig 2.
A) Representative confocal image stacks showing axons from WT and B) Par-1OE third instar larvae stained against Liprin-α (Green), DAB (Green), mito-GFP (Green) and HRP (Blue). Scale bar = 10μm. C) Quantification of Liprin-α, DAB, mito-GFP intensities from axons. N = 12, Liprin-α p = 0.49, DAB p = 0.09, and mito-GFP p = 0.82. Error bars represent S.E.M.

