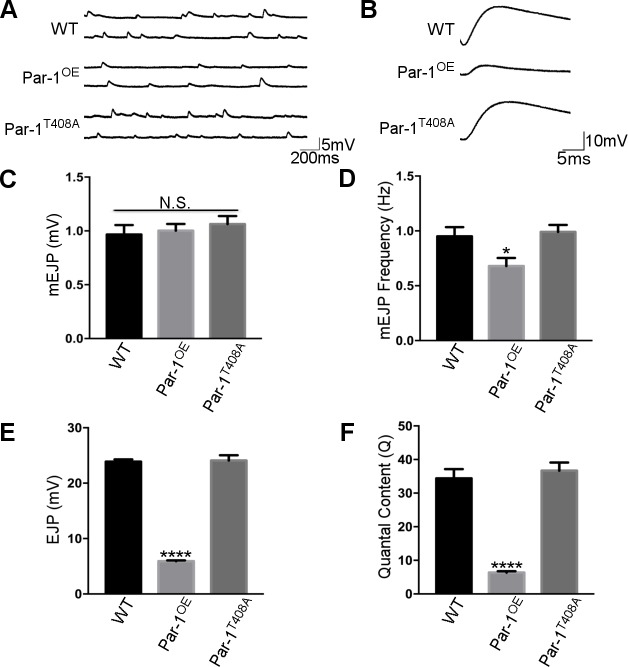
Fig 5.
A) Representative mEJPs from WT, Par-1OE, and Par-1T408A. B) Representative EJPs from WT, Par-1OE and Par-1T408A. C) Quantification of mEJP amplitude. N = 10, p = 0.65. D) Quantification of frequency of mEJPs N = 10, * = p<0.05. E) Quantification of EJP amplitude. N = 10, **** = p<0.0001. F) Quantification of Quantal Content. N = 10, **** = p<0.0001. Error bars represent S.E.M.

