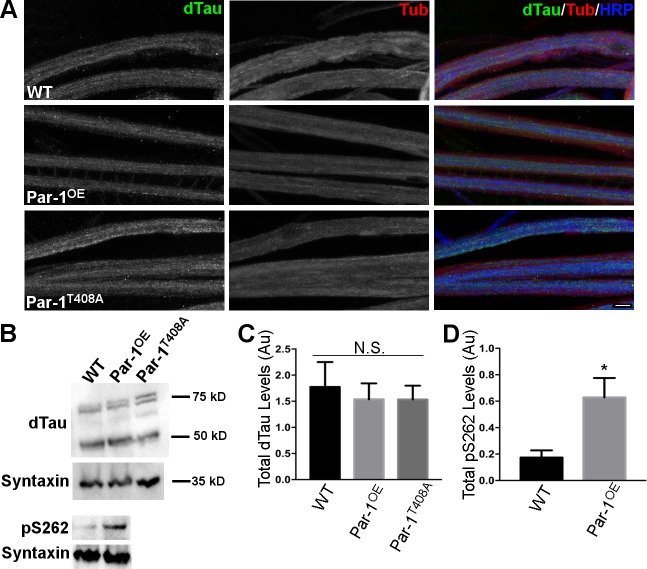
Fig 6.
A) Representative confocal image stack showing axons of WT, Par-1OE, and Par-1T408A third instar larvae stained with anti-dTau (Green), anti-Tubulin (Tub) (red) and anti-HRP antibodies (Blue). N = 10. Scale bar = 10μm. B) Representative Western blots from WT, Par-1OE and Par-1T408A using anti-dTau antibodies (upper panel). Western blot showing Tau phosphorylation at S262 site (pS262) of WT and Par-1OE is shown in the bottom panel. Syntaxin was used as a loading control. C) Quantification of Western blots showing total dTau levels in the head lysates. N = 3 independent experiments, p = 0.87. Error bars represent S.E.M. D) Quantification of Western blots showing levels of pS262 levels of Tau. N = 3 independent experiments, * = p = 0.04. Error bars represent S.E.M.

