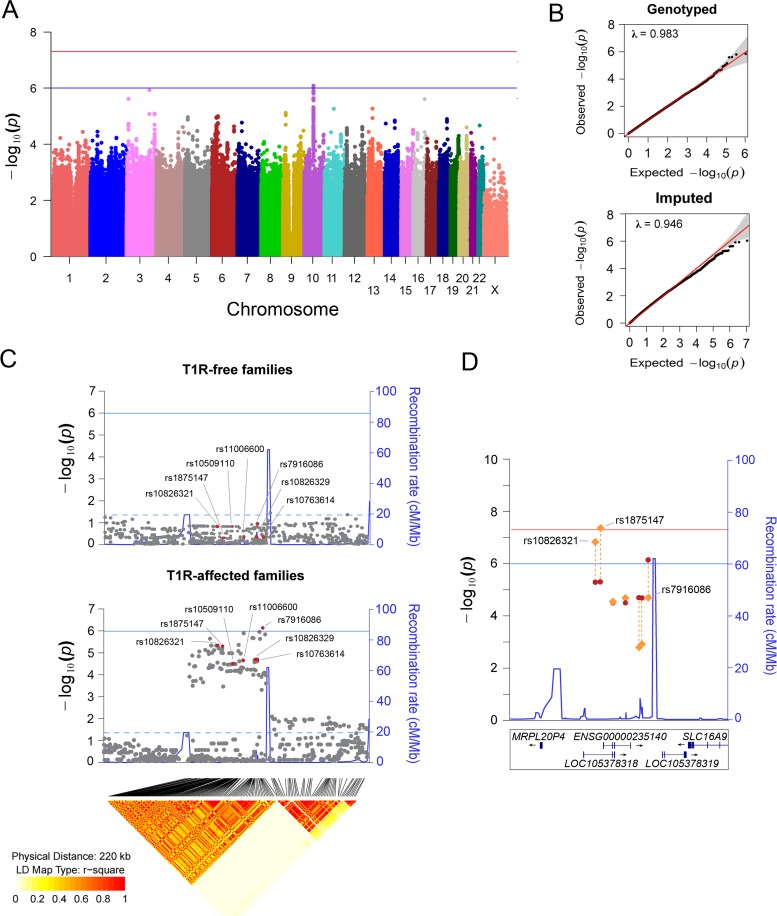
Fig 2. Variants on chromosome 10 are preferentially associated with T1R.
(A) Manhattan plot of the TDT results for the T1R-affected families in the discovery phase. Genetic variants represented by dots are plotted according to their chromosomal position on the x-axis against the negative log p values on the y-axis. The blue horizontal line indicates suggestive association (p = 1.0x10-06), and the red horizontal line represents significant association (p = 5.0x10-08). (B) Quantiles-Quantiles plots of genotyped and imputed variants for T1R-affected families in the discovery phase. Variants were plotted according to the observed p values on the y-axis and the expected p values on the x-axis. The 95% confidence interval dispersion is presented by grey shades. The slight deflation of the Q-Q plot is likely due to the sample size employed. (C) Visualization of a 220 kb region on chromosome region 10p21.2. Evidence of association for SNPs located in the interval is plotted for the T1R-free families and the T1R-affected families. The negative log of the p-value on the left y-axis is plotted against the chromosomal SNP position on the x-axis. The recombination rate in centimorgan per mega base is displayed on the right y-axis. The solid horizontal line indicates the suggestive association (p = 1.0 x 10−06) while the doted horizontal line represents nominal association (p = 0.05). The diamond plot at the bottom of panel C indicates the r2 linkage disequilibrium for variants nominally associated with T1R in 763 leprosy unaffected parents from both T1R-affected and T1R-free families. Highlighted in red are the leading SNPs in seven LD bins (r2 > 0.9). (D) Evidence for association of seven tag SNPs for the SNPs associated with T1R in the Chromosome10p21.2 region is shown for the discovery phase only (red dots) and for the combined analysis of all three samples (orange lozenges). The negative log of the p-value is indicated on the left y-axis. The recombination rate in centimorgan per mega base is displayed on the right y-axis and indicated by a blue line. The blue horizontal line indicates suggestive association (p = 1.0x10-06), and the red horizontal line represents significant association (p = 5.0x10-08). The genomic locations of RefSeq or ENSEMBL genes are given at the bottom.

