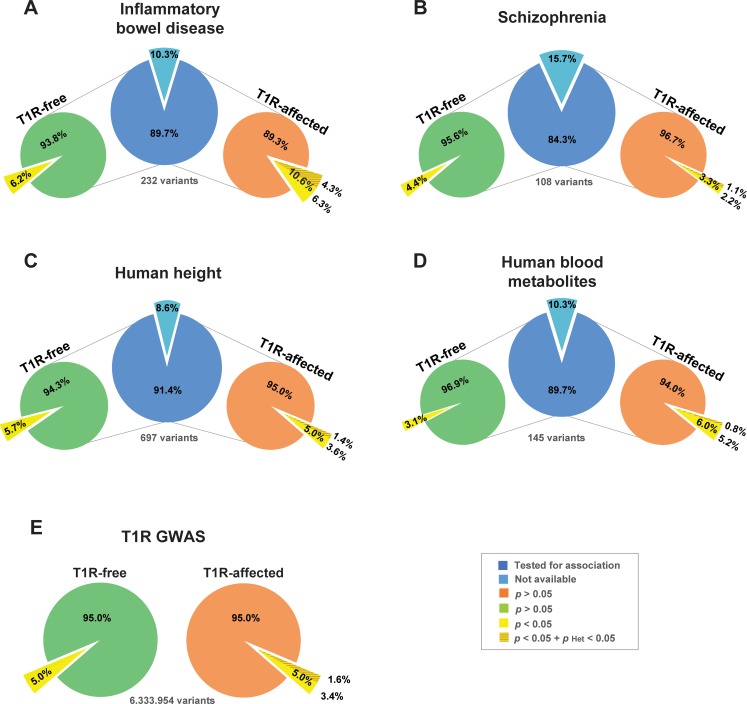
Fig 3. Enrichment of shared risk-alleles associated with T1R leprosy and IBD phenotypes.
GWAS loci for (A) Inflammatory Bowel Disease [24], (B) Schizophrenia [25], (C) Human height [26] and (D) Human blood metabolites [27] are represented by a single SNP with the strongest evidence for association. The count of SNPs is given below each central blue pie (panels A—D) for each disease. The light blue pie slices indicate the numbers of SNPs that were not available for comparisons with the leprosy families. The proportions of shared SNPs with T1R-free leprosy (left light green pie) and T1R leprosy (right light orange pie) are indicated as pies for each of the GWAS sets (panel A—D). The pies in panel E represents the totality of SNPs tested in the present study for T1R-free and T1R-affected families. The yellow slices indicate the proportion of SNPs with nominal evidence for association with T1R-free leprosy or T1R/leprosy. The darker shade of yellow represent the proportion of SNPs that are significantly heterogeneous between T1R free and affected leprosy patients. The hypergeometric test used as baseline the proportion of nominally associated GWAS SNPs to estimate the significance of enrichment of the T1R/leprosy and T1R-free leprosy GWAS SNPs among the four selected disease phenotypes.

