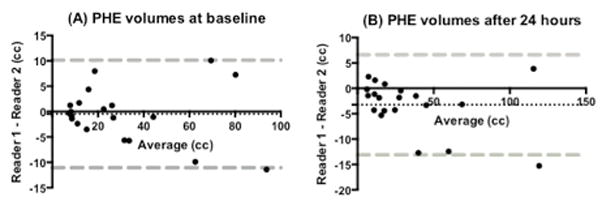
Figure 2.

Bland-Altman plots of interrater consistency of PHE measurements at baseline and 24-hours post-ICH. Dashed black line represents the bias (mean of the difference between measurements). Dashed gray lines represent the limits of agreement (mean ± 1.96 SD).
