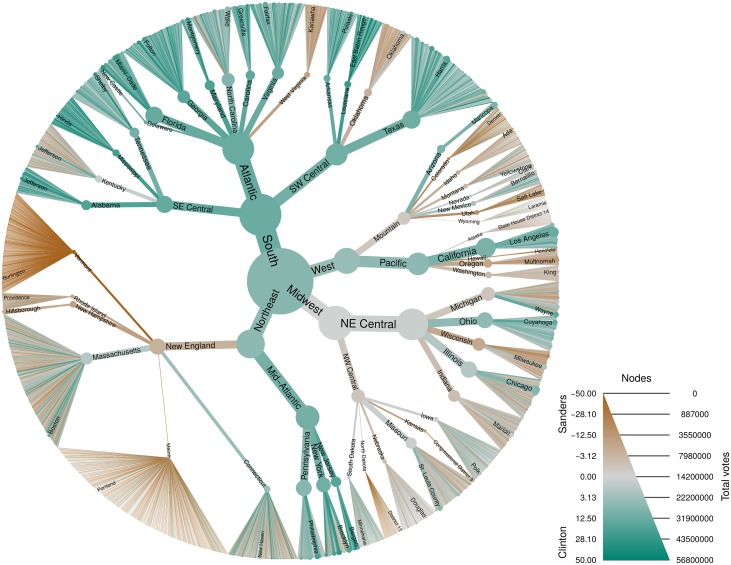
Fig 6. Metacoder can be used with any type of data that can be organized hierarchically.
This plot shows the results of the 2016 Democratic primary election organized by region, division, state, and county. The regions and divisions are those defined by the United States census bureau. Color corresponds to the difference in the percentage of votes for candidates Hillary Clinton (green) and Bernie Sanders (brown). Size corresponds to the total number of votes cast. Data was downloaded from https://www.kaggle.com/benhamner/2016-us-election/.

