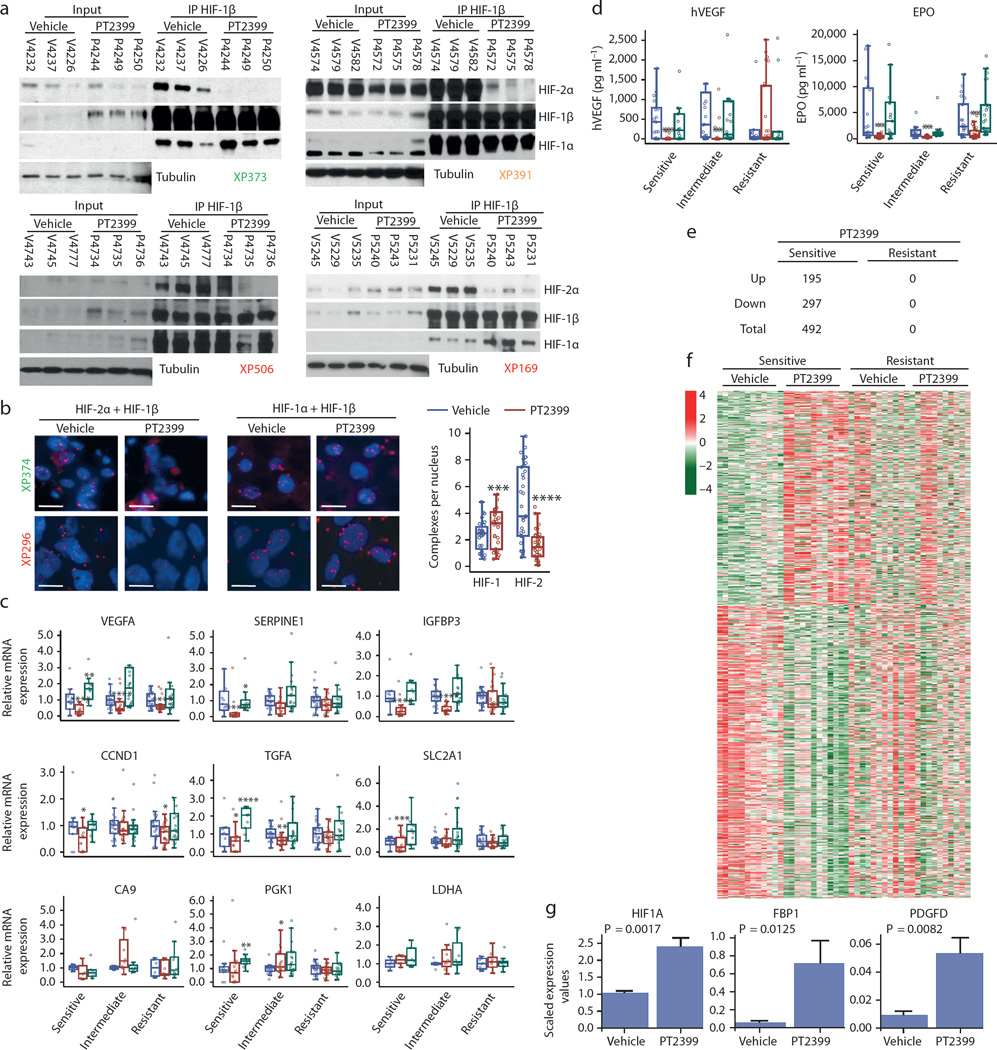
Fig. 2. PT2399 dissociates HIF-2 complexes in both sensitive and resistant RCCs and induces changes in gene expression in sensitive tumors.
a, Immunoprecipitation of HIF-1β from tumor lysates of sensitive (XP373), intermediate (XP391), and resistant (XP506 and XP169) tumors from mice treated with either vehicle (Veh) or PT2399. (Samples are labeled with “V” for vehicle-treated or “P” for PT2399-treated followed by the mouse identifier.) b, Proximity ligation assay detecting either HIF-2α + HIF-1β or HIF-1α + HIF-1β heterodimers from vehicle- or PT2399-treated sensitive (XP374) or resistant (XP296) tumors and summary of results across responsive and resistant tumorgrafts. (Images representative of quantitative data shown in graph.) Summary includes analyses from 11 vehicle-treated tumors and 11 PT2399-treated tumors (3 fields were analyzed for each sample) in 5 sensitive, 3 intermediate, and 3 resistant tumorgraft trials. Scale bars = 20 µM. c, qRT-PCR for the indicated HIF-2 target genes in PT2399 sensitive, intermediate, and resistant tumors treated with vehicle (blue), PT2399 (red), or sunitinib (green). HIF-1 target genes CA9, PGK1, and LDHA included as negative controls. Excepting PGK1 and LDHA, samples were available for n = 58 vehicle-treated tumors (Sensitive: n = 11; Intermediate: n = 21; Resistant: n = 26), n = 62 PT2399-treated tumors (Sensitive: n = 15; Intermediate: n = 21; Resistant: n = 26), and n = 52 sunitinib-treated tumors (Sensitive: n = 10; Intermediate: n = 23; Resistant: n = 19). PGK1 and LDHA were available for 24 tumors for each treatment group (Sensitive: n = 6; Intermediate: n = 8; Resistant: n = 10). d, Circulating tumor-produced hVEGF as well as mouse EPO levels in mice with sensitive, intermediate, and resistant tumors treated with vehicle (blue), PT2399 (red), and sunitinib (green). ELISA data was generated for 63 vehicle-treated tumors (Sensitive: n = 21; Intermediate: n = 19; Resistant: n = 23), 74 PT2399-treated tumors (Sensitive: n = 27; Intermediate: n = 21; Resistant: n = 26), and 61 sunitinib-treated tumors (Sensitive: n = 15; Intermediate: n = 23; Resistant: n = 23). e, Number of RNAs upregulated and downregulated genes by PT2399 in sensitive and resistant tumors. f, Heatmap representation from RNAseq analysis showing differentially-regulated genes by PT2399 in sensitive compared to resistant tumors. Removal of an unclassified tumor (XP169) from the resistant group, did not affect conclusions. g, RNAseq analyses showing increased expression of selected genes by PT2399 in sensitive tumors. b–d, g: Tests completed using a mixed model with compound symmetrical covariance structure for mice in the same tumorgraft line using vehicle as the reference group. qRT-PCR levels were log-transformed for analysis; EPO and hVEGF levels were Box-Cox transformed; RNAseq levels were log2-transformed; Raw values depicted in all graphs. All bar charts depict the mean with the error bar representing s.e.m., while all boxplots have median centre values. *, p < 0.05; **, p < 0.01; ***, p < 0.001; and ****, p < 0.0001. See Supplementary Fig. 1 for gel source data.

