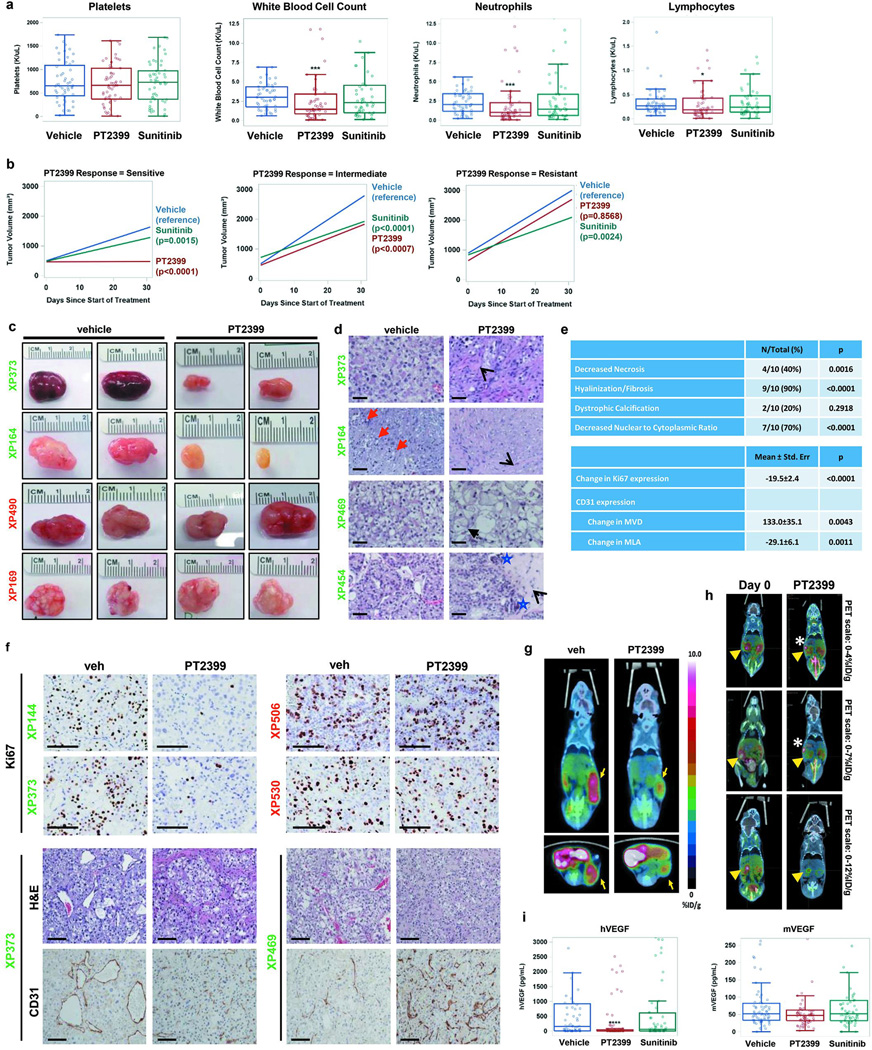
Extended Data Fig. 1. Effects of PT2399 on human RCC-bearing mice.
a, Platelet, white blood cell, neutrophil, and lymphocyte counts from tumorgraft-bearing mice treated with vehicle (n = 52), PT2399 (n = 58), or sunitinib (n = 53) at the end of drug trial period (~28 days). (Low lymphocyte levels throughout consistent with expected levels in age and sex matched NOD/SCID mice.) b, Tumor growth trend lines for sensitive, intermediate, and resistant groups after controlling for baseline tumor volume (refer to Fig. 1d for individual curves). c, Representative gross images of tumors from sensitive (XP373 and XP164; green) and resistant (XP490 and XP169; red) lines at the end of drug trial. d, Representative H&E images illustrating different effects of PT2399 on sensitive tumors including patchy intercellular fibrosis and hyalinization (open arrow heads), reduced tumor necrosis (red arrows), decreased tumor cell density (XP164 and XP469), reduced nuclear to cytoplasmic ratio (XP469), cell ballooning (filled arrow), and dystrophic calcification (blue stars). Scale bars = 50 µM. e, Summary of histopathological changes induced by PT2399 in 10 sensitive tumorgrafts represented as number of tumors (N) compared to the total or as mean ± s.e. in 28 vehicle-treated tumors compared to 31 PT2399-treated tumors. MVD, microvessel density per mm2; MLA, mean lumen area (μm2). PT2399 collapsed tumor vasculature without decreasing number of CD31-expressing endothelial cells. f, (Upper panel) Immunohistochemistry (IHC) for Ki67 in tumors harvested from sensitive (XP144 and XP373) or resistant (XP530 and XP506) tumors following treatment with vehicle or PT2399. (Lower panel) H&E staining and IHC for CD31 in sensitive tumors (XP373 and XP469) treated with vehicle or PT2399. Scale bars = 100 µM. g, Representative [18F]FLT-PET/CT images of mice with subcutaneous tumorgrafts treated with either vehicle or PT2399. Yellow arrows point to tumors where there is uptake of [18F]fluoro-3'-deoxythymidine. h, Representative [18F]FLT-PET/CT images of XP144 mice with orthotopic tumors before and after treatment with PT2399 for 10 days. Yellow arrowheads, kidney tumors. White asterisks, intestine. FLT uptake in tumor compared to normal kidney reduced by 19% after 10-day treatment (n = 3; paired t-test p=0.0010). i, Human and mouse VEGF levels in plasma as determined by ELISA in different treatment groups (Vehicle: n = 63; PT2399: n = 74; Sunitinib: n = 61). a, i: Tests completed using a mixed model analysis with compound symmetrical covariance structure for mice in the same tumorgraft line using vehicle as the reference group. b: Trend lines were obtained from a mixed model analysis for each response group using an autoregressive (1) covariance structure for the longitudinal measurements on each mouse, compound symmetry for mice within the same tumorgraft line, and controlled for baseline volume. e: Continuous measures were analyzed using a mixed model with compound symmetrical covariance structure for mice in the same tumorgraft line and using vehicle treatment as the reference group. Specifically for categorical variables, a binomial test was used to test if the proportion of tumors affected by PT2399 compared to vehicle was different than 10%. hVEGF, and mVEGF levels were Box-Cox transformed; Raw values depicted in all graphs. All boxplots have median centre values. *, p < 0.05; ***, p < 0.001; and ****, p < 0.0001.

