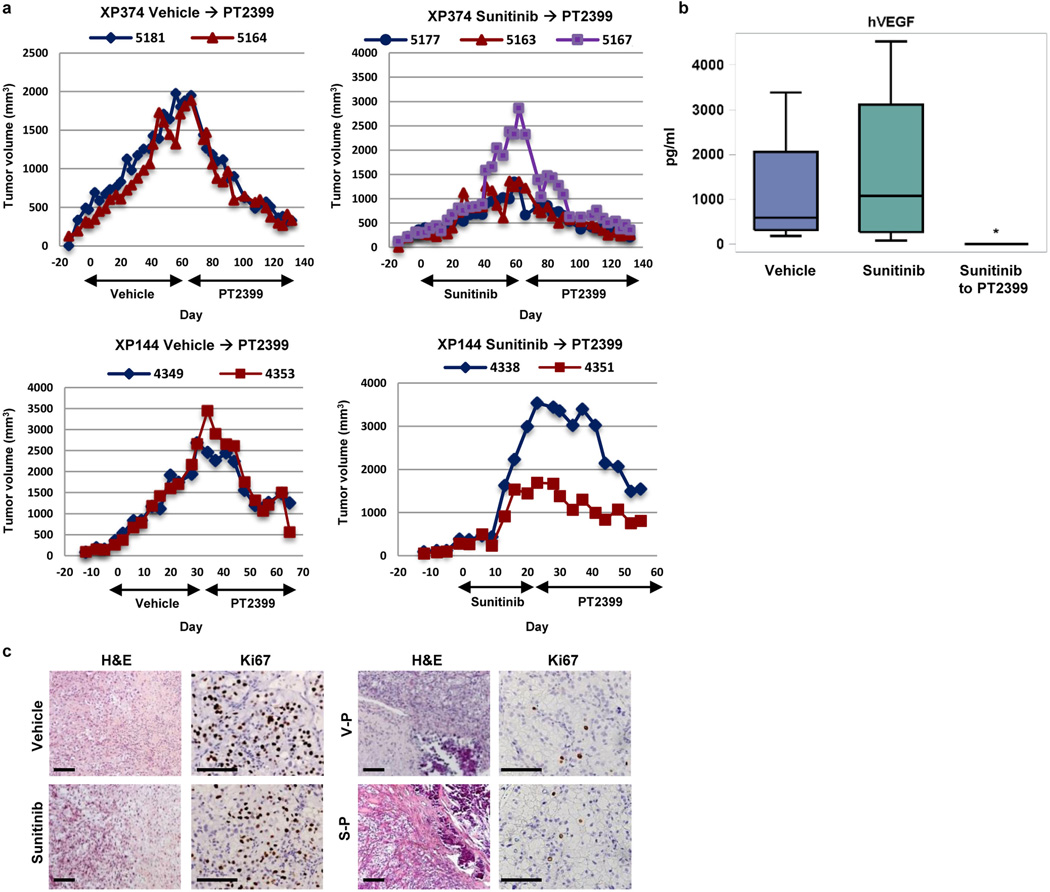
Extended Data Fig. 2. Evaluation of the effects of PT2399 on tumors progressing on sunitinib.
a, Tumor volumes in mice from sensitive lines (XP374 or XP144) switched from vehicle or sunitinib to PT2399 as indicated (bottom black arrows). b, Circulating tumor-produced hVEGF levels in mice treated with vehicle, sunitinib, or sunitinib followed by PT2399. The Wilcoxon rank-sum test was used to determine if sunitinib (n = 4) or sunitinib followed by PT2399 (n = 6) were different than vehicle (n = 4). *, p<0.05. Boxplots have median centre values. c, Representative images of H&E and Ki67 staining of tumors from mice (XP144) treated with vehicle or sunitinib (left panel) and from tumors following a switch to PT2399 (right panel). Scale bars = 100 µM.

