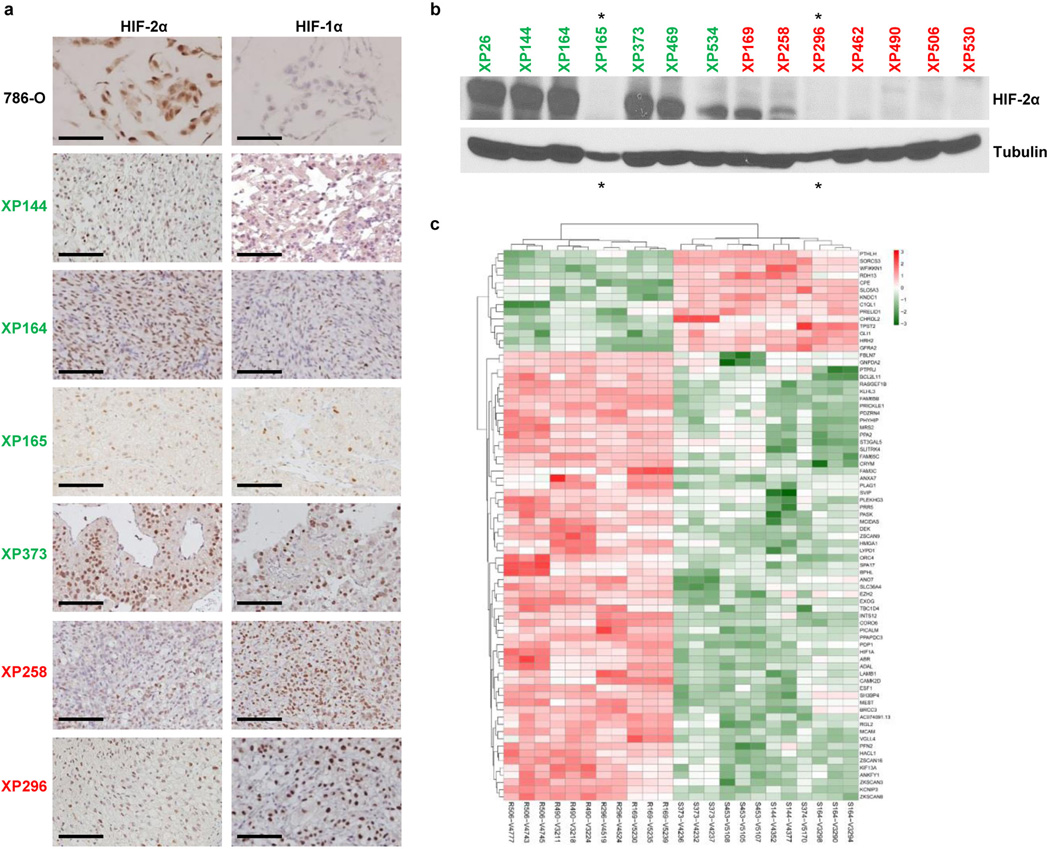
Extended Data Fig. 4. HIF-2α and HIF-1α levels in sensitive and resistant tumorgrafts.
a, HIF-2α and HIF-1α immunohistochemistry. 786-O cells, which express high levels of HIF-2α, shown as controls. Scale bars, 100 µm. b, Western blot analyses showing heterogeneity within tumors but with overall similar results (compare to Fig. 3c). Green, sensitive; Red, resistant. Asterisks, underloaded samples. c, Heatmap from RNA-seq analysis showing differentially expressed genes in sensitive (S) versus resistant (R) tumourgrafts based on uniform cutoff (see Extended Data Table 3). See Supplementary Fig. 1 for gel source data.

