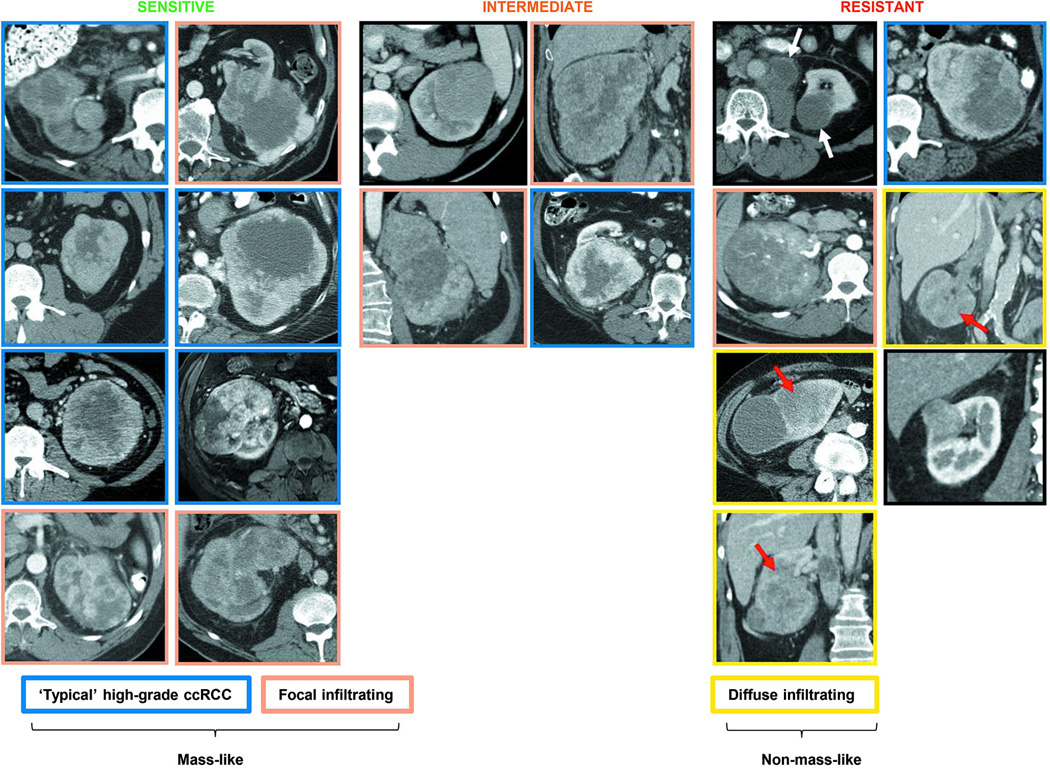
Extended Data Fig. 5. Evaluation of imaging characteristics of tumors in patients corresponding to sensitive, intermediate, and resistant tumorgrafts.
CT scan images from patient tumors that gave rise to tumorgrafts according to TG sensitivity to PT2399. Tumors were classified into masses with peripheral hypervascularity and a central non-enhancing area (blue outline), focally infiltrating (brown outline) and diffuse infiltrating (yellow outline). Three of the seven resistant tumors presented as non-mass-like, infiltrative neoplasms (red arrows) whereas another tumor presented with both a largely necrotic renal mass and retroperitoneal lymph nodes (black outline; white arrows).

