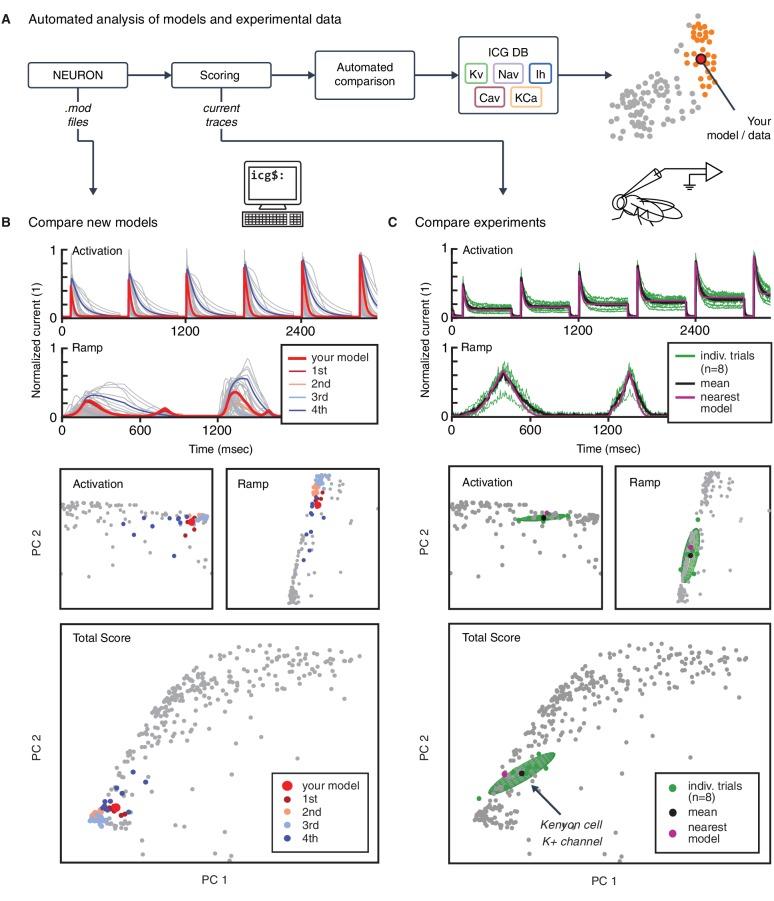
Figure 6. Automated analysis of new models and experimental data.
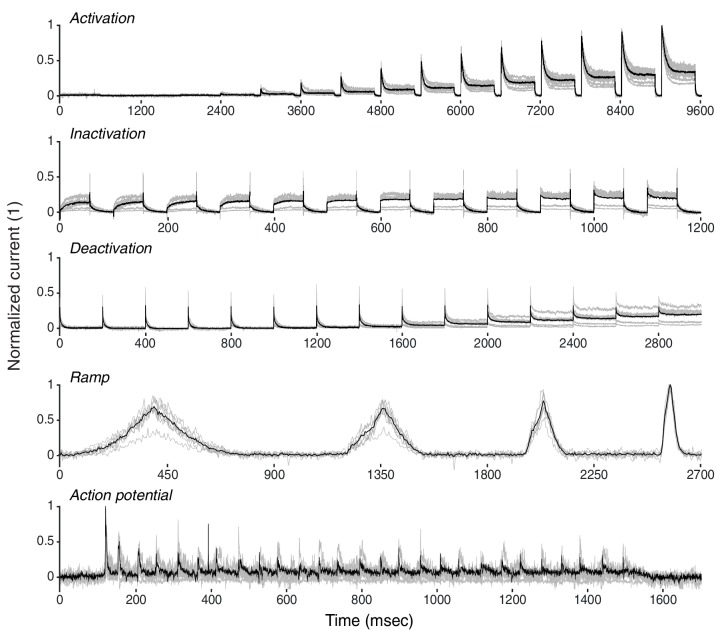
(A) Flowchart of data processing steps involved in automated comparison. Source code for model files written in NEURON can be uploaded to the website, and current responses are automatically generated. Current traces are processed to compute scores, which are compared to all models in the resource (illustrated in B). Additionally, raw current traces obtained experimentally (or from models in other languages) can be uploaded and analyzed directly (illustrated in C). (B) Example analysis and comparison of a new ion channel model (kad.mod from Hsu et al. (2015); ModelDB ID no. 184054). Top: Segments of the current response traces (red) for activation (voltage steps 10–60 mV) and ramp protocols (first half), along with the closest four clusters (other colors: mean currents, gray lines: individual currents). Bottom: first two principal components of score space for activation and ramp protocols, as well as total score. (C) Example analysis of in vivo recordings of a K+ current from Drosophila Kenyon cells (see Materials and methods for details and Figure 6—figure supplement 1 for full traces) and comparison to ICG resource. Top: mean (n = 8 recordings, black) and individual recordings (green). Bottom: mean (black dot) and individual experimental recordings (green dots) plotted in the first two principal components of score space (ellipsoid illustrates the variance across individual recordings). Comparison is made to the nearest (in score space) ion channel model in the resource (magenta; Kv4_csi, ModelDB ID no. 145672). Gray dots in B and C are scores of Kv channel models in the resource.


