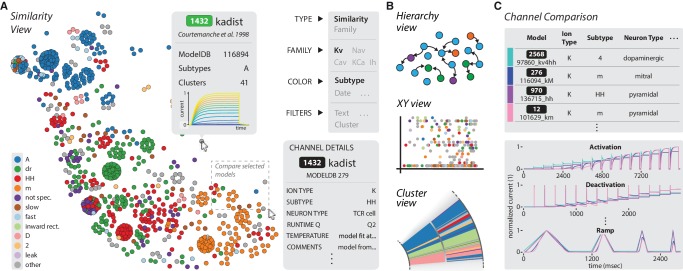
Figure 7. The ICGenealogy website allows for the interactive visualization of all data and analysis on the resource (ICGenealogy, 2016) (http://icg.neurotheory.ox.ac.uk).
(A) Schematic of similarity view on website. Channel models of the Kv family are displayed in the first two principal components of score space, colored by subtype (legend on left). Hovering over models brings up information tooltip (center), and clicking on a model displays Channel Details (bottom right). Selected models can be compared by click-and-drag (see instruction manual in Supplementary file 1 for more details). (B) Schematic of other three views available on the website. Hierarchy view: models are displayed in a graph with edges that represent family relations. XY view: any two selected metadata are plotted against each other. Cluster view: models are organized in a ring partitioned by clusters. (C) The channel comparison displays selected channels side-by-side with metadata (top) and current responses (bottom).

