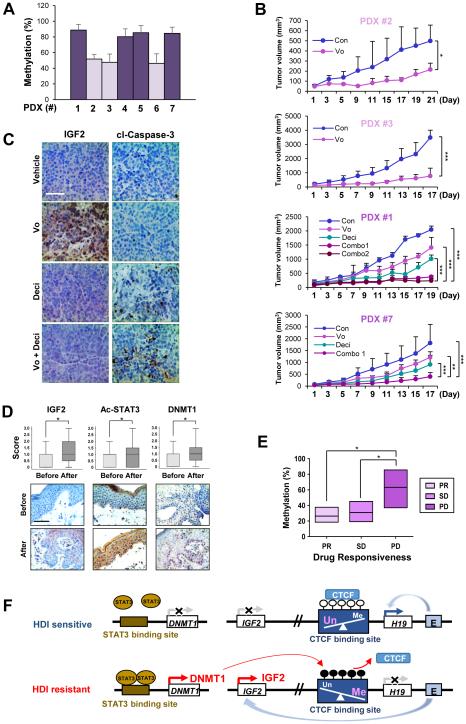
Figure 6. Restoration of vorinostat sensitivity by the inhibition of DNMT in PDX models with hypermethylation of the H19/IGF2 ICR and association of IGF2, acetylated STAT, DNMT1 and the methylation levels at the H19/IGF2 ICR with vorinostat resistance in CTCL patients.
(A) Real-time PCR analysis revealed varying degrees of methylation in the H19/IGF2 ICR in tumors from seven PDX models. (B) Co-treatment with decitabine (0.4 mg/kg) and vorinostat (50 mg/kg) suppressed tumor growth in PDX models harboring xenografts with hypermethylation of the H19/IGF2 ICR compared to single treatment of vorinostat (combo 1: concurrently treated with decitabine and vorinostat; combo 2: pretreated decitabine [four times] and then co-treated with vorinostat; combo [for #7]: sequential treatment with the two drugs). The tumor volumes of each group at day 0 (start of vorinostat treatment) and during 17-21 days of drug treatment are presented. (C) Representative immunohistochemical images showing that co-treatment of decitabine and vorinostat leads to decreased IGF2 expression and increased apoptosis in PDX #1 model compared to single treatment with vorinostat. Scale bar: 50 μm. (D) IHC analysis indicating increased expression levels of IGF2, acetylated STAT3, and DNMT1 in the paired tissue samples from patients with CTCL after oral vorinostat treatment (6 weeks, n = 12). Scale bar: 50 μm. (E) Real-time PCR results showing the extent of DNA methylation in the H19/IGF2 ICR in CTCL patient groups showing differing clinical outcomes to vorinostat therapy (PR: partial response; SD: stable disease; PD: progressive disease). The data are presented as the mean ± SEM (A; n = 3-6) and the mean ± SD (B: n = 6-8; D: n =12). Significance was determined by one-way ANOVA (B, E) and Wilcoxon signed-rank test (two-tailed) (D) (*: P < 0.05; **: P < 0.01; ***: P < 0.001). Vo: vorinostat. (F) A schematic diagram illustrating a mechanism underlying cancer resistance to vorinostat. In vorinostat-sensitive cancer cells, the hypomethylated CTCF-binding sites at the IGF2/H19 ICR allow for the binding of CTCF and the transactivation of the H19 promoter by the downstream enhancers, thereby preferentially expressing H19 and silencing IGF2. On the other hand, in cancer cells with vorinostat resistance, the accumulation of acetylated STAT3 induces the transactivation of the DNMT1 promoter and subsequently increases the methylation of the CTCF-binding site in the IGF2/H19 ICR. These changes prevent CTCF from binding to the CTCF-binding sites, and in turn, the downstream enhancers gain access to the IGF2 promoter, leading to the transactivation of IGF2 and subsequent activation of the IGF-1R signaling pathway.

