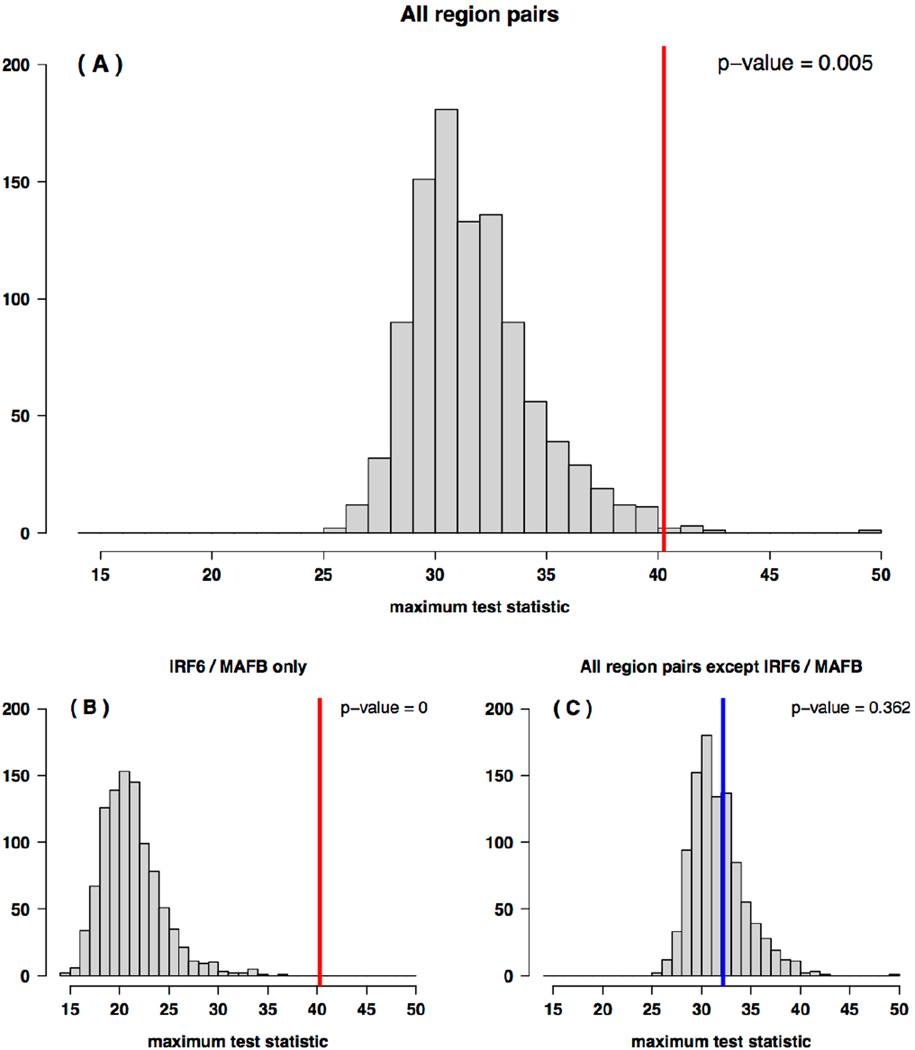
Figure 1.
Distributions of the maximum 4 degree-of-freedom likelihood ratio test statistics, across all pairwise SNP-SNP interactions, for 1,000 permutation case-parent trio data sets of European ancestry. (A) The maximum test statistic across all SNP-SNP interactions in all 78 region pairs. The largest observed test statistic (LRT=40.25) is indicated by the red vertical line. (B) The maximum test statistic across all SNP-SNP interactions in the IRF6 / MAFB pair. (C) The maximum test statistic across all SNP-SNP interactions in all region pairs except the IRF6 / MAFB pair. The largest observed test statistic (LRT=32.17) is indicated by the blue vertical line.

