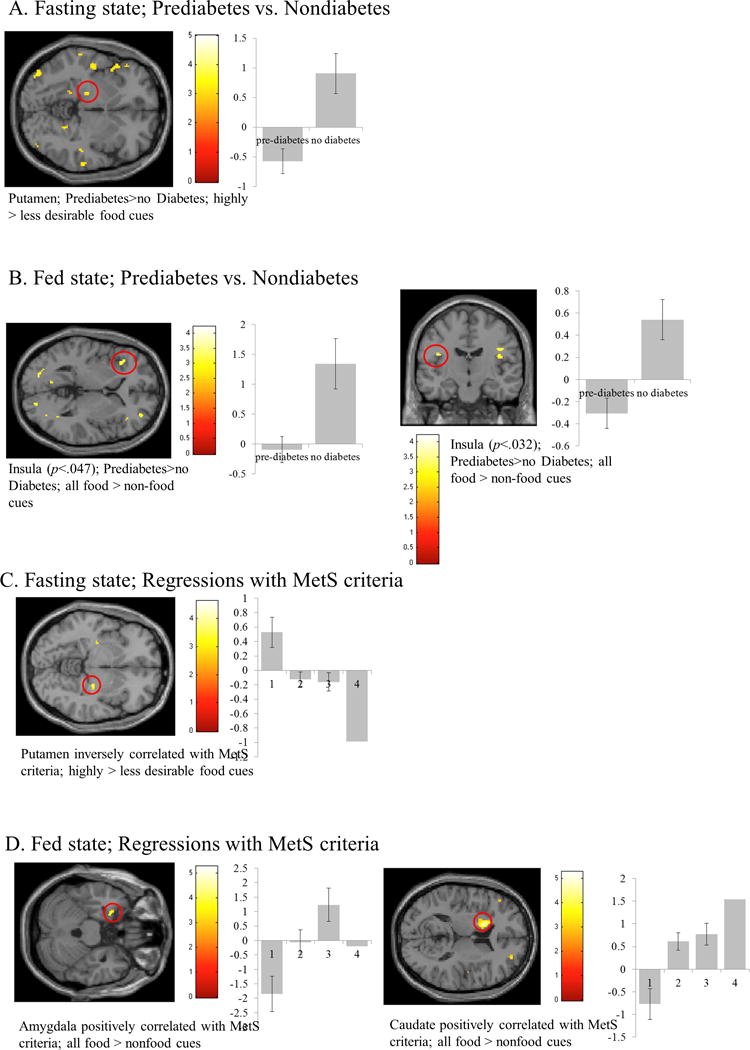
Figure 1.

Results from small volume correction (SVC) analysis of obese prediabetics vs. nondiabetics in the fasting (A) and fed (B) states and with the number of MetS criteria met in the fasting (C) and fed (D) states (see Supplemental Table 2). Areas significant at p<.05, FWE corrected for multiple comparisons are circled in red. The y-axis represents effect size of the activation (z scores). BOLD contrasts are superimposed on a T1 structural image in neurological orientation. The color bar represents voxel T value.
