
Figure 3. LC11 is contrast selective, omni-directional, and end-stopped on the spatial scale of one receptive field.
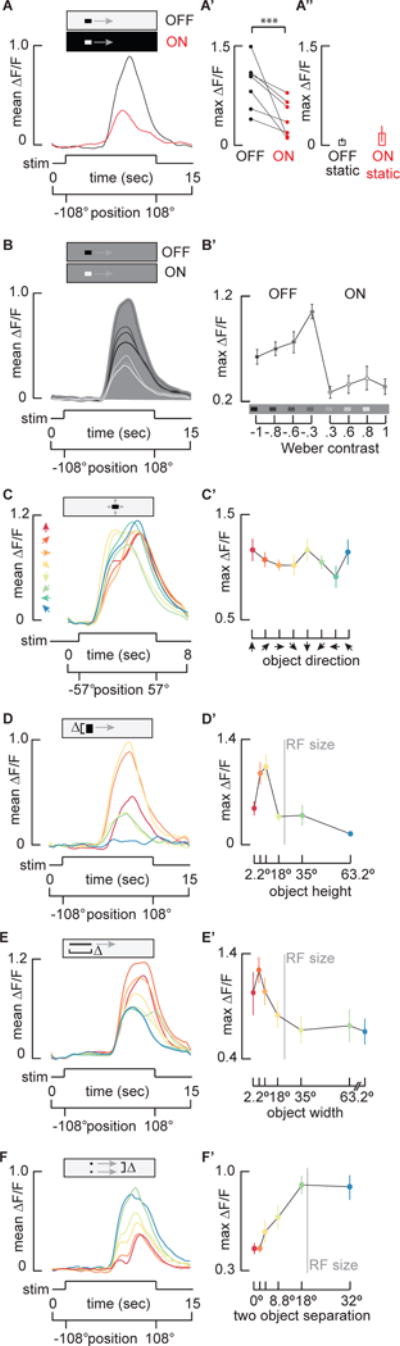
A) Mean GCaMP6m signal from the LC11 terminal output glomerulus in response to a 30°by 8.8° moving ON object (red) and moving OFF object (black, n = 7 flies). A′). Pairwise comparison of maximum ΔF/F of responses from each preparation (***p<0.001, paired t-test, n = 7 flies). A″) Average maximum responses (±S.E.M.) of LC11 glomerulus to a stationary 30°by 8.8°OFF and ON object placed within the hotspot of the receptive field (n = 6 flies). B) Mean GCaMP6m signal from the LC11 glomerulus in response to varying contrast objects. Grayscale of the filled area is used to indicate the intensity of the visual background, whereas grayscale of the response line indicates intensity of the stimulus object (n = 9 flies). The most contrasting objects do not elicit the maximum responses from LC11. B′) Average of maximum responses (±S.E.M.) of the LC11 glomerulus to objects of varying contrast. Schematic on the x-axis shows the intensity of the background compared to each object. Weber contrast values are indicated numerically (see Supplemental Experimental Procedures, one-way ANOVA, n = 9 flies). C–F) LC11 glomerulus responses to parameterized direction (C, C′), vertical height (D, D′) horizontal width (E, E′), and two-object separation distance (F, F′). Time series responses shown in A–F, and color coded parameter values and maximum responses (±S.E.M) shown in C′–F′. C and C′) LC11 is omni-directional. An 8.8° square object was moved in 8 different directions in 45° steps as indicated by color-coded arrowheads (n = 7 flies, see single cell responses in Figure S3). D and D′) LC11 is vertically size tuned. A 30° wide object was moved on the same horizontal trajectory, with varied vertical heights: 2.2°, 4.4°, 8.8°, 18°, 35°, 73.2°, colors mapped to object size in B′ (n = 7 flies). Vertical gray line indicates average receptive field (RF) size (Figure 2). E and E′) LC11 is horizontally size tuned. An object of fixed height (8.8°) and varied width: 2.2°, 4.4°, 8.8°, 18°, 35°, 70°, 210°, was moved horizontally (n = 15 flies). The leading edge of each object appeared on the LED display at the same time. Vertical gray line indicates average estimated functional RF size (Figure 2). F and F′) LC11 is inhibited by a second object. Two 8.8° square objects moved on parallel trajectories. The distance between them was 0°, 2.2°, 4.4°, 8.8°, 18° and 32°, colors mapped to separation distance in C′ (n = 6 flies). Vertical gray line indicates average RF size (Figure 2). See also Figure S3.