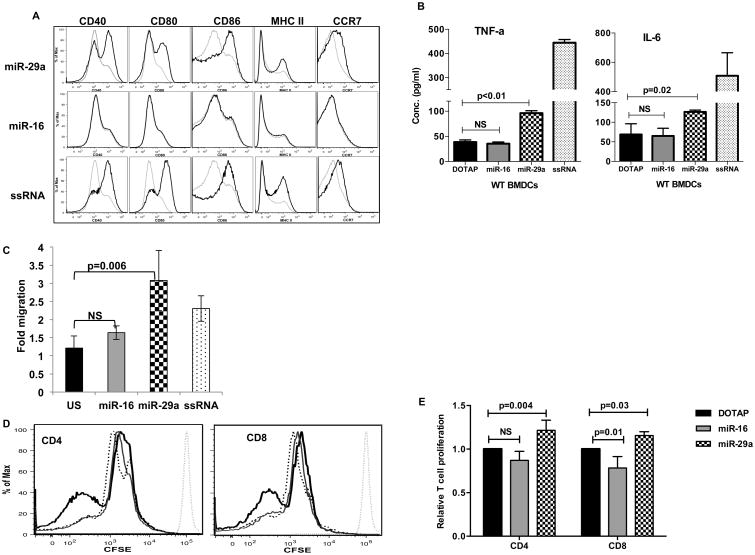
Figure 2. miR-29a induces maturation of murine bone marrow derived dendritic cells.
Day 6 BMDCs were washed and treated with DOTAP-miR29a (1μg/ml), miR-16 (1μg/ml), DOTAP alone or ssRNA (ssRNA40/LyoVec™ 5μg/ml, Invivogen) for 48 hrs.
(A) Flow cytometric analysis of maturation markers CD40, CD80, CD86, MHCII and CCR7. Grey histogram, DOTAP alone; Black histogram, indicated treatment. One representative experiment of three is shown. (B) Detection of TNF-α and IL-6 in supernatants by ELISA. Samples were assayed in triplicate and results are shown as the means of three independent experiments. (C) BMDC were washed and cells (5×10⁵) were placed in a Transwell migration chamber and allowed to migrate for 3 hrs at 37°C. SLC/CCL19 (200 ng/ml) was placed in the lower chamber to induce CCR7-dependent chemotaxis. Lower chambers with medium only served as a control for spontaneous migration. CCL19-dependent migration was calculated according to the formula: Migration Index (MI) = number of cells CCL-19/number of cells medium only. The mean ±SEM of two independent experiments performed in triplicate is presented. (D) Day 6 B6D2F1 BMDCs were washed and treated with for 48 hrs with DOTAP-miR-29a/miR-16 or DOTAP alone to induce maturation. B6 T cells were stained with CFSE and incubated with allogeneic BMDC (stimulator: effector =1:5). Cell division was measured by CFSE dilution after 7 days. Dotted grey histogram, undivided T cell peak; dashed black histogram, DOTAP alone; grey histogram, DOTAP-miR-16; black histogram, DOTAP-miR29a. One representative experiment of three is shown. (E) Bar plots showing relative T cell proliferation of experiment described in D. Data (CFSE MFI) was normalized to the DOTAP alone group, and is represented as mean ±S.D. of three independent experiments.

