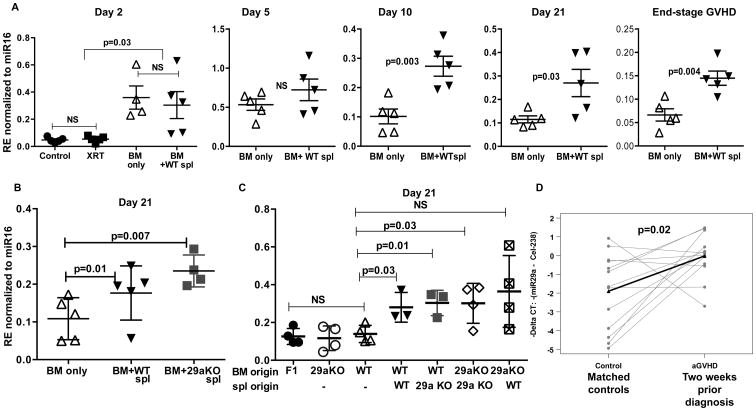
Figure 5. Kinetics and origin of serum miR-29a expression.
(A) Lethally irradiated B6D2F1 recipient mice received either T cell depleted WT bone marrow (BM only) or BM+B6 WT splenocytes (BM+ WT spl). Healthy, non-irradiated mice and irradiated alone mice receiving no cell infusion (XRT) were used as controls for early time-points. Recipients were sacrificed at indicated time-points post-transplant, RNA isolated from serum and miR-29a expression relative to miR-16 analyzed by real-time PCR. 4-5 mice were used per group per time point; one representative experiment of two is shown. (B) Lethally irradiated B6D2F1 recipient mice received either T cell depleted bone marrow (BM only) or BM+B6 WT splenocytes (BM+ WT spl) or BM+ miR29a knockout splenocytes (BM+29a KO spl). Recipients were sacrificed at day 21 post-transplant and relative miR-29a expression determined as described before. (C) Transplant was performed, recipients sacrificed at day 21 post-transplant and relative miR-29a expression determined as described earlier. Donor cell infusions are indicated on the x-axis. P values were determined by unpaired t-test. (D) miR-29a expression as measured by real-time PCR in serum two weeks prior to clinical diagnosis of aGVHD in 13 cases and matched controls. Expression is depicted as negative delta CT values, with higher values corresponding with higher expression. Spike-in c. elegans-238 was used as normalizer. P value was determined by paired t-test.

