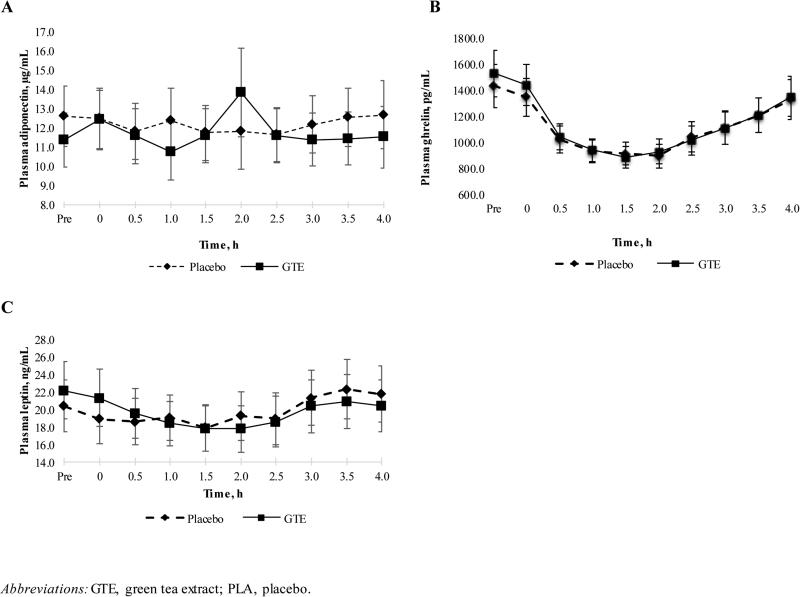
Figure 2. Mean postprandial adiponectin (A), ghrelin (B), and leptin (C) concentrations in overweight or obese postmenopausal women randomized to GTE or Placebo for 12 months.
The x-axis is labeled in units of hours, with “Pre” indicating the pre-meal (fasting) blood draw. The placebo group (n=30) is indicated by a dashed line and the green tea extract (GTE) group (n=30) is indicated by solid black line.

