Figure 3.
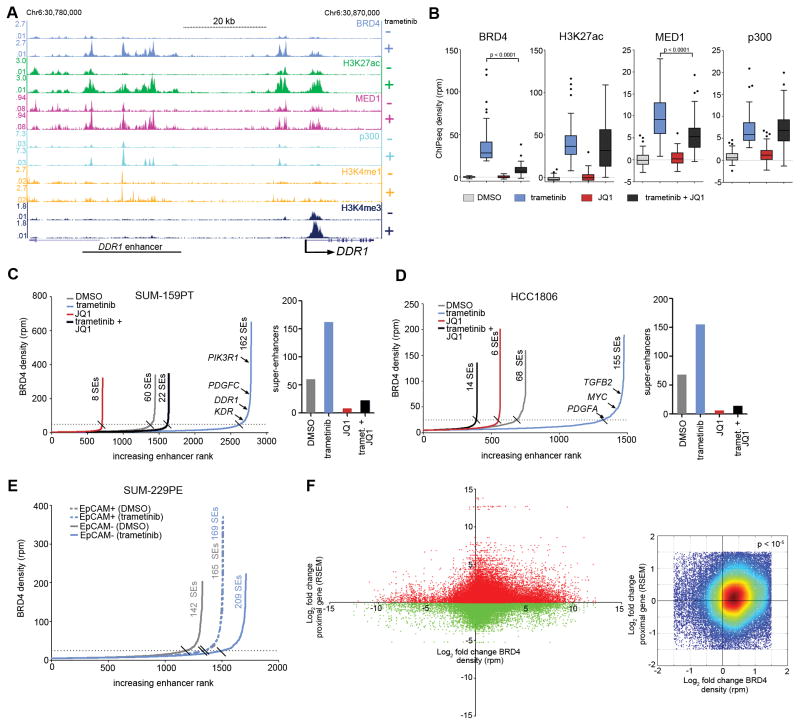
Remodeling of epigenomic landscape induced by MEK inhibition. (A) SUM-159PT ChIPseq density tracks at the DDR1 adaptive response RTK locus in the presence or absence of 24 h 100 nM trametinib. (B) Response of BRD4, H3K27ac, MED1, and p300 ChIPseq density to 24 h 100 nM trametinib alone, or the combination of 300 nM JQ1 at the highest 50 ranking BRD4 peaks defined by trametinib induction magnitude. Quantification of enhancers and super-enhancers by BRD4 density following 24 h 100 nM trametinib, 300 nM JQ1 or the combination in SUM-159PT (C) or HCC1806 (D) cells. (E) Enhancer quantification by BRD4 density following 24 h 30 nM trametinib in SUM-229PE EpCAM+/CD49f+ (dotted lines) or EpCAM−/CD49f− (solid lines) cells. (F) Left: Fold change of genome-wide BRD4 stitched peak ChIPseq density vs. transcriptional fold change of genes whose TSS resides +/− 200 kb from the BRD4 peak density in SUM-159PT cells with 24 h 100 nM trametinib. Right: Zoom of plot on left with warmer colors representing higher density of points showing enrichment in upper right quadrant. Empirical p value (< 10−5) from randomization test indicates that in each of 10,000 cycles of data randomization the number of points under the null hypothesis of no enrichment did not exceed the number of observed counts for this quadrant.

