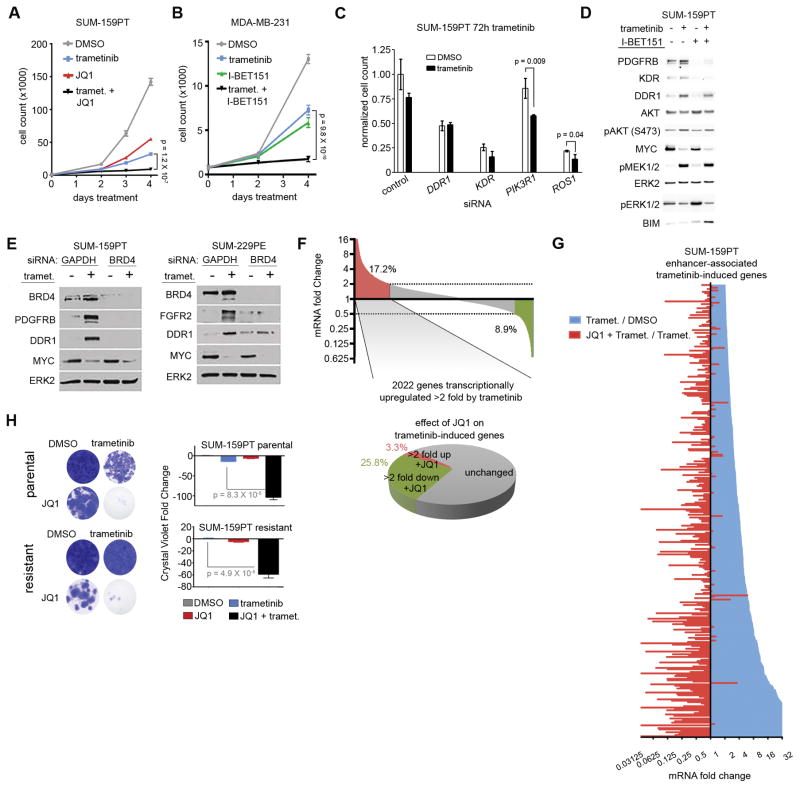
Figure 5.
BET bromodomain inhibition enhances growth suppression elicited by MEK inhibition. (A) SUM-159PT four day growth curve with 30 nM trametinib, 300 nM JQ1, or the combination. (B) MDA-MB-231 (CL) four day growth curve with 30 nM trametinib, 500 nM I-BET151, or the combination. (C) Cell counting assay showing growth suppression in SUM-159PT cells in the presence or absence of 72 h 1 nM trametinib and the indicated siRNAs, normalized to non-targeting control siRNA. In the DMSO condition, all super-enhancer associated siRNAs yielded significantly different (p < 0.05) growth suppression relative to control siRNA except for PIK3R1. P values are indicated for siRNAs that showed significantly different growth suppression between DMSO and trametinib conditions. (D) Westerns with indicated antibodies in SUM-159PT cells treated 24 h with 100 nM trametinib, 500 nM I-BET151, or the combination. (E) Westerns showing loss of adaptive response RTKs in SUM-159PT cells (left) or SUM-229PE parental cells (right) in cells after 48 h 10 nM trametinib and BRD4 siRNA. (F) Top: SUM-159PT RNAseq showing percentage of genes induced (red) or suppressed (green) > 2 fold by 100 nM trametinib. Bottom: Percentage of trametinib-induced genes further induced (red) or suppressed (green) > 2 fold by co-treatment with 300 nM JQ1. (G) Long tail plot of trametinib mRNA induction or JQ1 mRNA suppression (100 nM trametinib : DMSO, or 100 nM trametinib + 300 nM JQ1 : 100 nM trametinib) for enhancer-associated genes with > 2 fold trametinib-induced expression change. (H) Four-week crystal violet assays in SUM-159PT parental cells (top) or SUM-159R (bottom) cells in the presence or absence of 30 nM trametinib or 300 nM JQ1.

