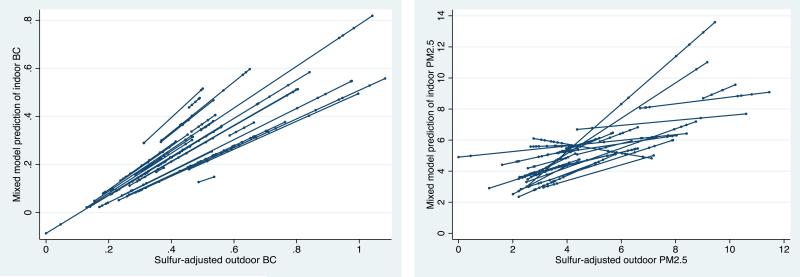
Figure 3. Random Effects of School on PM2.5 and Black Carbon.
Left Panel: Plot of the predicted indoor PM2.5 levels by the outdoor source contribution. Each point represents a classroom measure; each line represents a school's linear prediction that incorporates its school-specific random intercept and random slope. Right Panel: Plot of the predicted indoor BC levels by the outdoor source contribution. Each point represents a classroom measure; each line represents a school's linear prediction that incorporates its school-specific random slope (random intercept not included due to little school-level variation).

