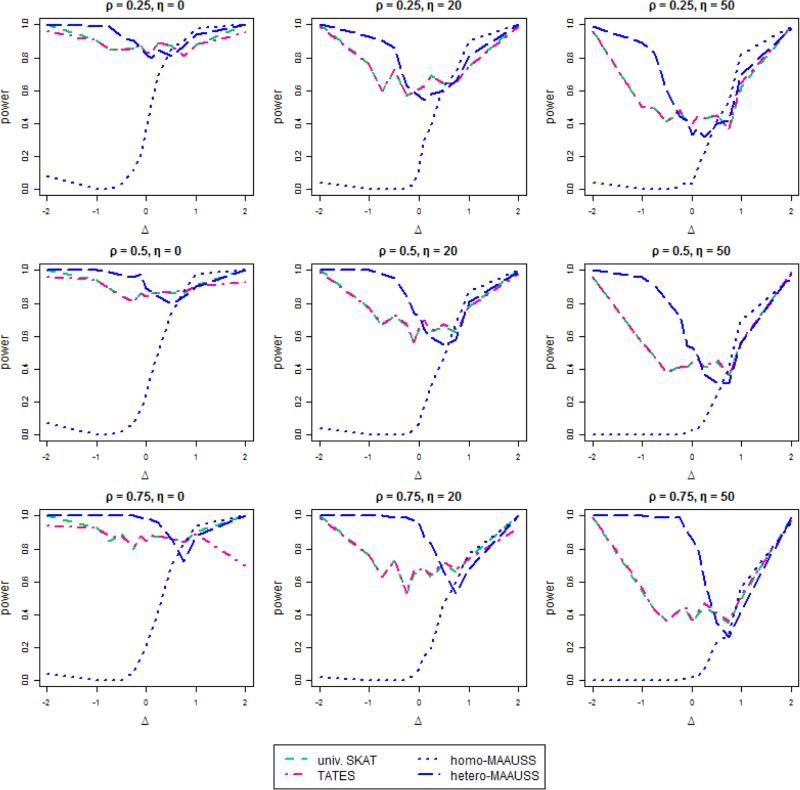
Figure 1. The power of MAAUSS compared with univariate SKAT and TATES when c1 = 0.2.
The effect of the j-th SNP on the first phenotype βj1 is 0.2|log10MAFj| and the effect on the second phenotype is Δ × βi1. The x-axis presents Δ and the y-axis represents the statistical power, i.e., the proportion of significant results among 100 tests at a significance level of α = 10−6. The three plots in each row show the different settings of η. that are the proportions of different directions of effects on a phenotype. The three plots in each column represent the different correlations between phenotypes, ρ.

