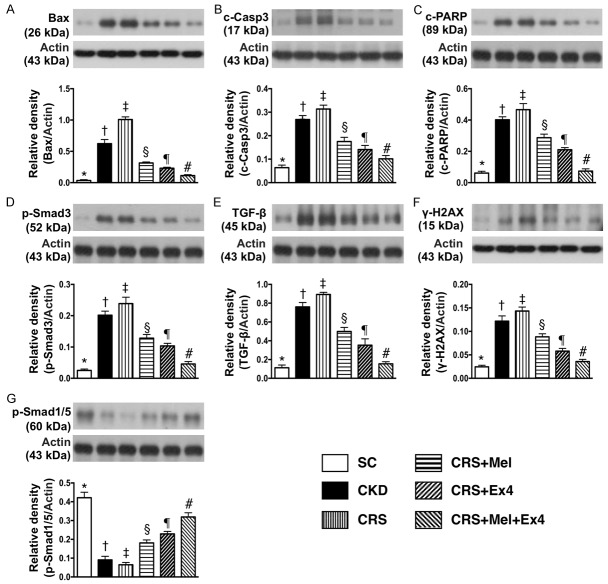
Figure 5.
Protein expressions of apoptotic, fibrotic, DNA-damaged and anti-fibrotic biomarkers in kidney parenchyma by day 60 after CRS induction. A: Protein expression of Bax, * vs. other groups with different symbols (†, ‡, §, ¶, #), P<0.0001. B: Protein expression of cleaved caspase 3 (c-Casp-3), * vs. other groups with different symbols (†, ‡, §, ¶, #), P<0.0001. C: Protein expression of cleaved Poly (ADP-ribose) polymerase (c-PARP), * vs. other groups with different symbols (†, ‡, §, ¶, #), P<0.0001. D: Protein expression of Samd3, * vs. other groups with different symbols (†, ‡, §, ¶, #), P<0.0001. E: Protein expression of transforming growth factor (TGF)-β, * vs. other groups with different symbols (†, ‡, §, ¶, #), P<0.0001. F: Protein expression of γ-H2AX, * vs. other groups with different symbols (†, ‡, §, ¶, #), P<0.0001. G: Protein expression of Smad1/5, * vs. other groups with different symbols (†, ‡, §, ¶, #), P<0.0001. All statistical analyses were performed by one-way ANOVA, followed by Bonferroni multiple comparison post hoc test (n = 8 for each group). Symbols (*, †, ‡, §, ¶, #) indicate significance (at 0.05 level). SC = sham control; CKD = chronic kidney disease; CRS = cardiorenal syndrome; Mel = melatonin; Ex4 = exendin-4.

