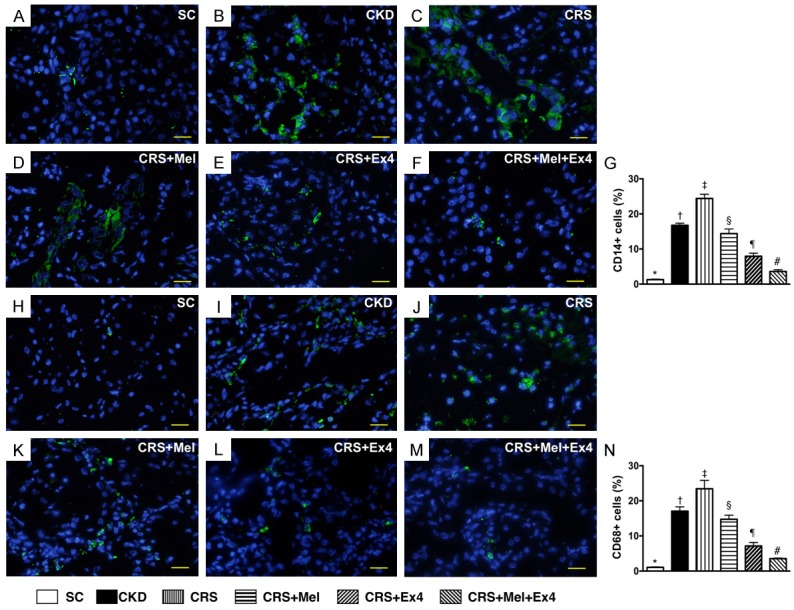
Figure 6.

Infiltrations of Inflammatory cells in kidney parenchyma by 60 after CRS induction. A-F: Illustrating the immunofluorescent (IF) microscopic finding (400 ×) of CD14+ cells (green color) in kidney parenchyma. G: Analytic results of number of CD14+ cells, * vs. other groups with different symbols (†, ‡, §, ¶, #), P<0.0001. H-M: IF microscopic finding (400 ×) of positively-stained CD68 cells (green color). N: Analytical results of number of CD68+ cells, * vs. other groups with different symbols (†, ‡, §, ¶, #), P<0.0001. Scale bars in right lower corner represent 20 µm. All statistical analyses were performed by one-way ANOVA, followed by Bonferroni multiple comparison post hoc test (n = 8 for each group). Symbols (*, †, ‡, §, ¶, #) indicate significance (at 0.05 level). SC = sham control; CKD = chronic kidney disease; CRS = cardiorenal syndrome; Mel = melatonin; Ex4 = exendin-4.
