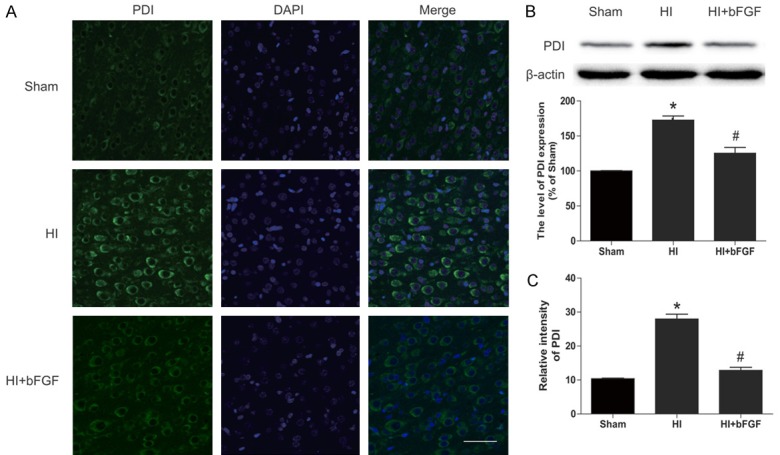
Figure 5.

The effects of bFGF on the ER stress-related protein PDI in the brains of rats after HI. A. Representative micrographs showing immunofluorescence with PDI. Nuclei were labelled with DAPI (blue) in each group. B. Representative western blot and quantification data of the ER stress marker PDI in the sham group, HI group and HI bFGF-treated group. *represents P<0.05 versus the sham group, and #represents P<0.05 versus the HI group. C. Optical density analysis of PDI from A. *represents P<0.01 versus the sham group, and #represents P<0.01 versus the HI group. All data represent the mean value ± SEM, n=4.
