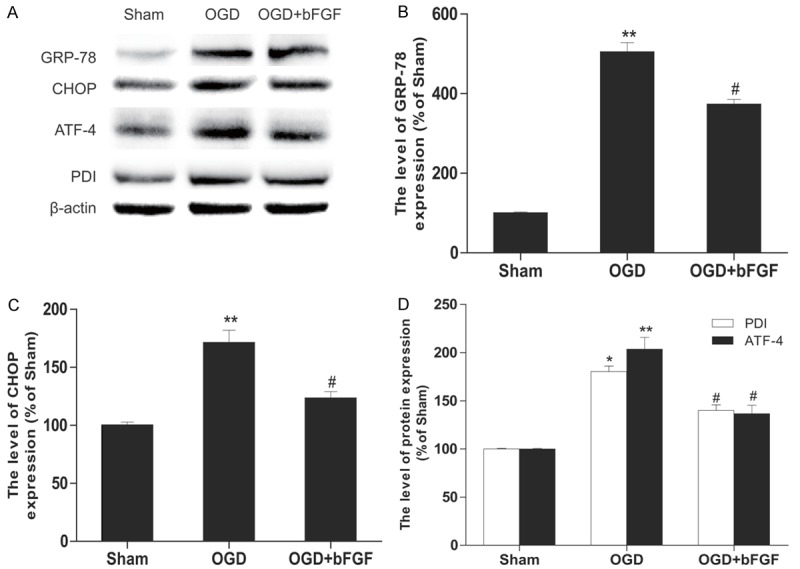
Figure 8.

bFGF inhibits OGD-induced ER stress in PC12 cells. A. The western blotting results for GRP78, CHOP, ATF-4, and PDI. B. Optical density analysis of GRP78. C. Optical density analysis of CHOP. D. Optical density analysis of PDI and ATF-4. **represents P<0.01 versus the sham group, and #represents P<0.05 versus the OGD group. All data represent the mean value ± SEM, n=4.
