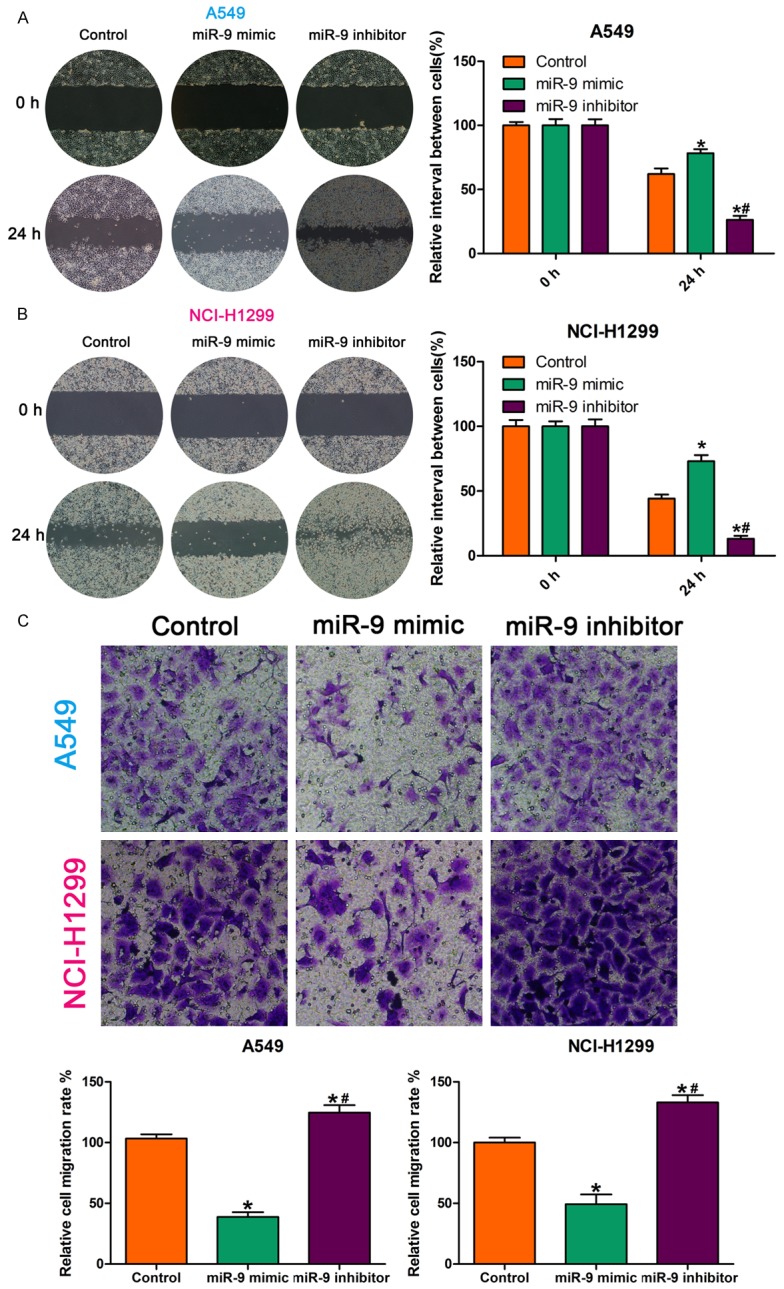
Figure 1.

MiR-9 regulated NSCLC cell invasion and migration. A, B. Wound healing assay showing that, compared with the control, the miR-9 mimic reduced cell migration capability and that the miR-9 inhibitor increased it. *P < 0.05 vs. control; #P < 0.05 vs. miR-9 mimic. C. Images and quantification of NSCLC cell migration following treatment with miR-9 mimic, miR-9 inhibitor, or control. Migrated cells were stained with crystal violet and counted. *P < 0.05 vs. control; #P < 0.05 vs. miR-9 mimic. All data are the mean ± SD.
