Figure 1.
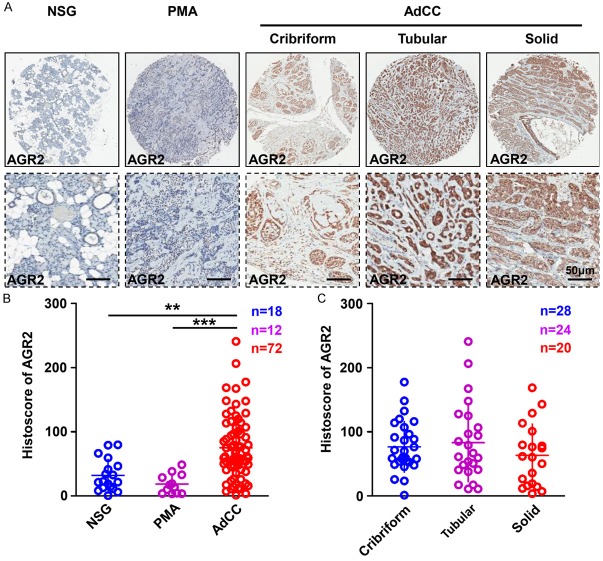
Overexpression of AGR2 in human salivary adenoid cystic carcinoma tissue microarray. A. Representative AGR2 IHC staining images of normal salivary gland (NSG), pleomorphic adenoma (PMA) and salivary adenoid cystic carcinoma (AdCC), scale bar = 50 μm. B. Quantification of AGR2 histoscore in NSG, PMA and AdCC, AGR2 was significantly increased in AdCC (Mean ± SEM, **P<0.01, ***P<0.001, one way ANOVA post tukey test). C. Quantification of AGR2 histoscore in cribriform, tubular and solid AdCC, There is no significant difference in the histoscore of AGR2 among the three types of AdCC (Mean ± SEM, one way ANOVA post tukey test).

