
Figure 2.
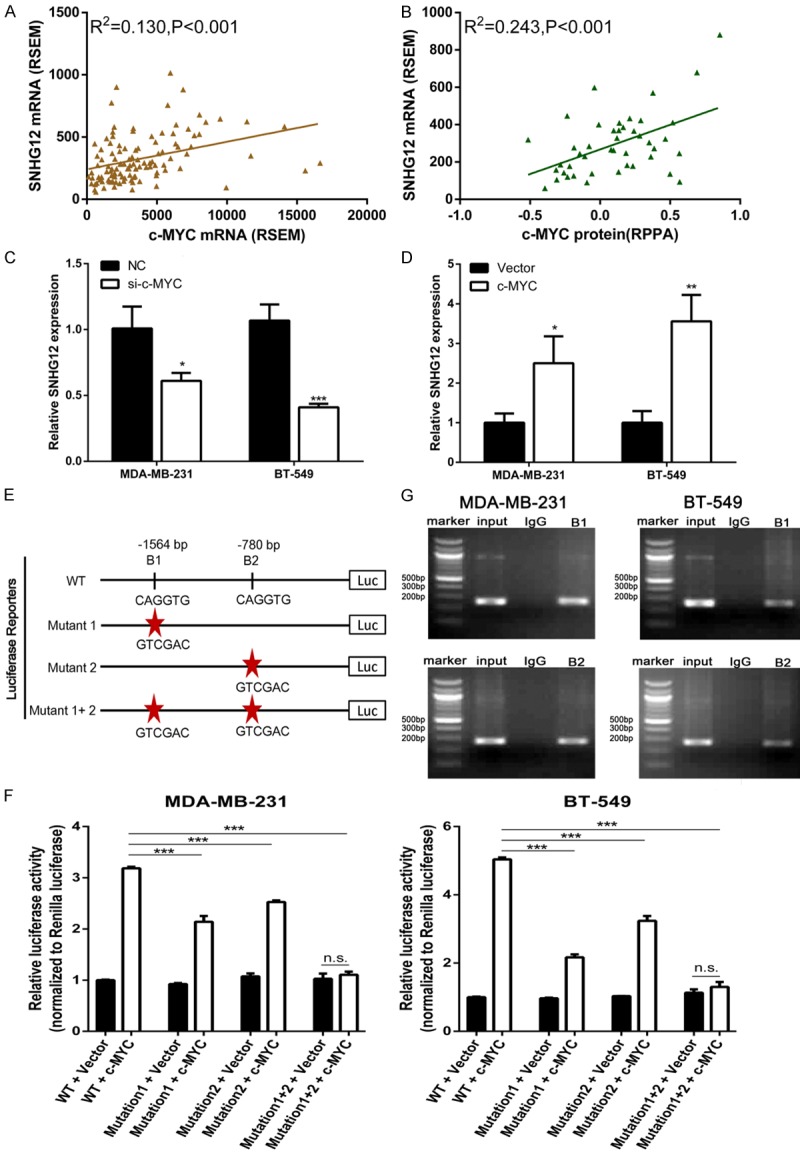
SNHG12 was activated by c-MYC. A, B. The TNBC cohort in the TCGA database was accessed and analyzed. The correlation between c-MYC mRNA level as well as c-MYC protein level and lncRNA SNHG12 transcript level was analyzed. The RNA expression level was calculated by the RNASeq by the Expectation Maximization (RSEM) algorithm, and protein expression level was represented for Reverse Phase Protein microArray (RPPA). C, D. The expression level of SNHG12 was determined using qRT-PCR in TNBC cells following treatment of cells with c-MYC siRNA or overexpression plasmid, respectively. E. A schematic diagram depicting the promoter region of SNHG12 containing two c-MYC-bound motifs at 1564 bp (B1) and 780 bp (B2) upstream of SNHG12. Sequences having mutations in (B1) and (B2) were also shown. F. Dual luciferase assays on MDA-MB-231 and BT-549 cells cotransfected with firefly luciferase constructs containing the SNHG12 promoters and vector or c-MYC-expressing plasmid. G. Chromatin from MDA-MB-231 and BT-549 cells was immunoprecipitated with the indicated antibodies. PCR was performed on immunoprecipitated DNAs or soluble chromatin using the specific primer pair for the SNHG12 promoter. Input was used as a positive control and IgG as a negative control. *P < 0.05, **P < 0.01, ***P < 0.001.