
Figure 3.
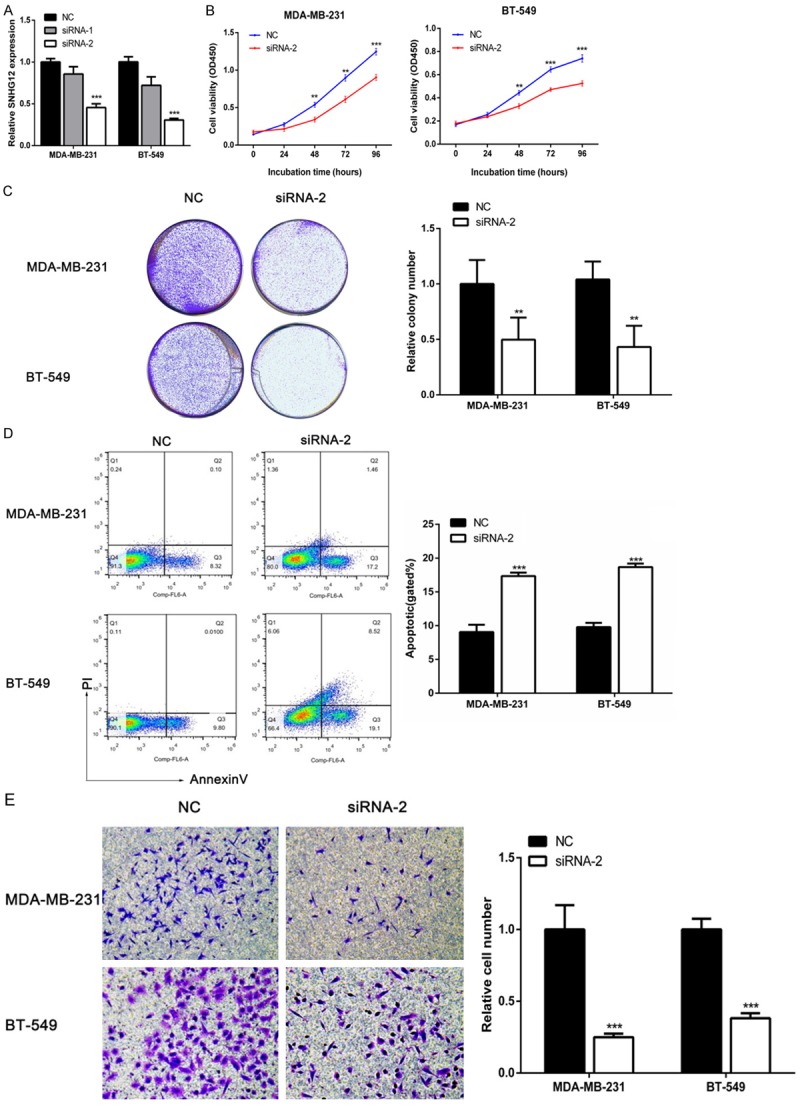
Attenuated expression of SNHG12 suppressed TNBC cells proliferation, migration and induced apoptosis. A. The SNHG12 expression level was determined by qRT-PCR when MDA-MB-231 and BT-549 cells were transfected with siRNA. B, C. The relative cell proliferation in MDA-MB-231 and BT-549 cells was measured after the cells were transfected with siRNA-2 or negative control (NC) using CCK-8 assays and colony-forming assays. D. The apoptosis rate of the two TNBC cell lines transfected with siRNA-2 or NC were measured using flow cytometry assays. E. Transwell assays were used to determine the migration ability of the cells that were transfected with siRNA-2 or NC. **P < 0.01, ***P < 0.001.