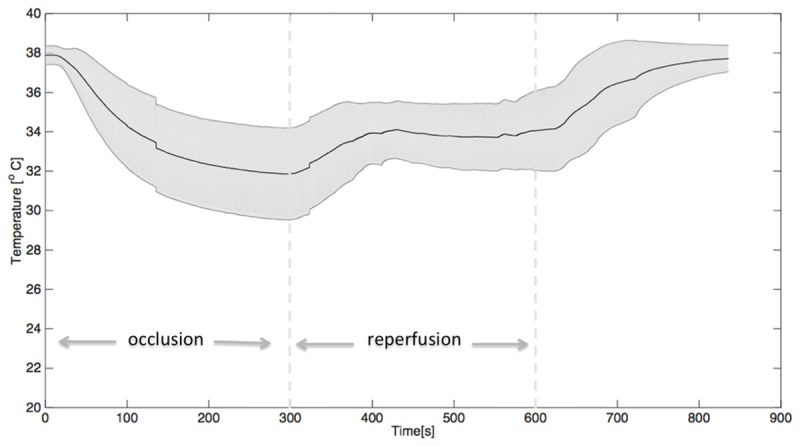
Figure 5.

Graph demonstrating the mean ± SEM of the temperature in the infarct area recorded in the five experiments. At 300 seconds, the first dotted line indicates the start of reperfusion when changing the infusion temperature from 22°C to 4°C. After 600 seconds (the second dotted line) the infusion of cold saline is stopped, whereafter temperatures normalize within minutes.
