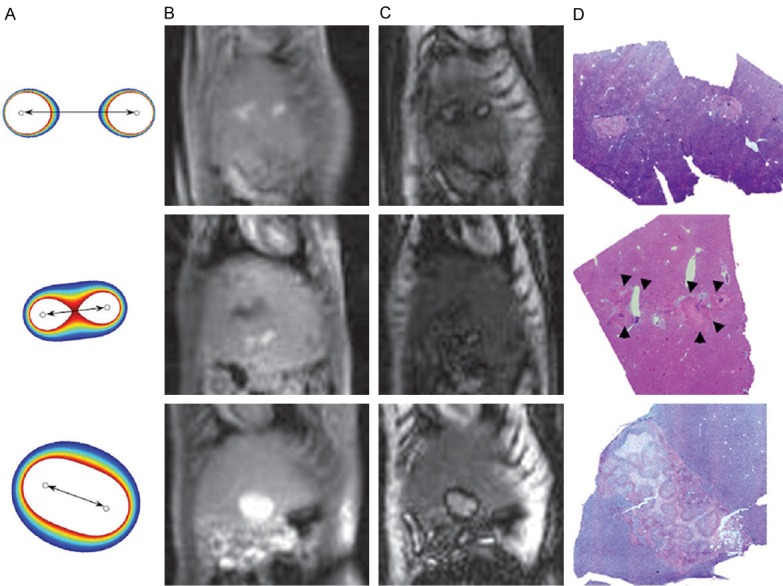
Figure 4.

IRE effects on the healthy liver in rats. A: Finite-element modeling simulations showing the anticipated IRE zone (white area) and RE penumbra (colored zones) corresponding to the 3 different electrodes configurations. B: Post-IRE T1-weighted gradient-echo MRI. C: Post-IRE inversion recovery MRI adjusted to null the signal in the RE penumbra. D: Corresponding hematoxylin-eosin-stained histology slices. Reproduced with permission from [24].
