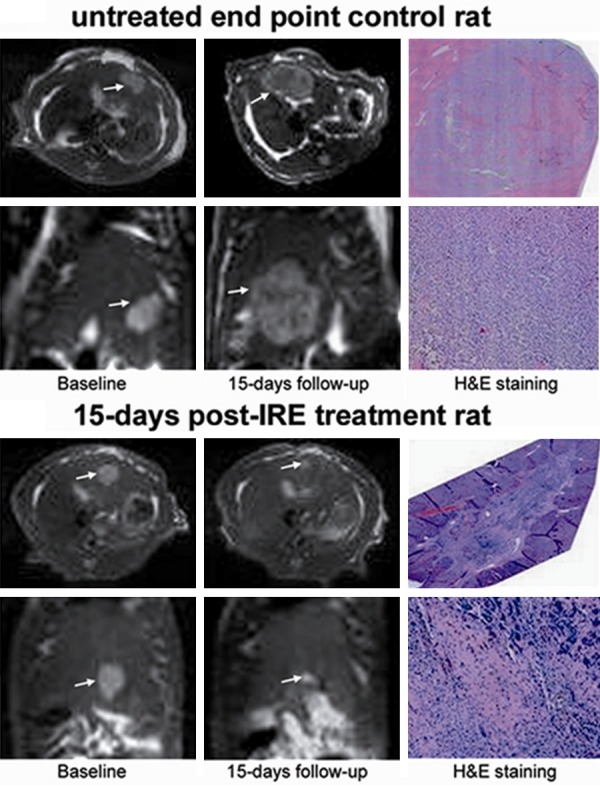
Figure 5.

Comparison of MRI and histology in rats with HCC, untreated or treated with IRE. Top panel: untreated rat; bottom panel: IRE-treated rat. Left: axial and coronal baseline T2-weighted images, acquired shortly before IRE for the treated rats. Center: axial and coronal T2-weighted images acquired 15 days later. Right: corresponding ematoxylin-eosin-stained histology slides. Reproduced with permission from [25].
