
Figure 3.
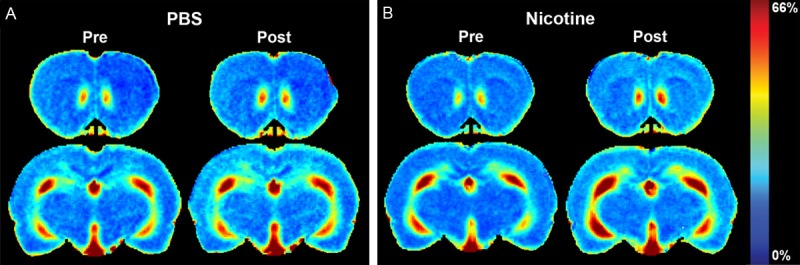
Time-averaged signal increase maps of a control and a nicotine injected rat. The color bar for the enhancement maps is at the right of the panel B. A. Time-averaged signal increase maps of controls containing ACB and HIP at pre- and post-PBS injection. B. Time-averaged signal increase maps of the nicotine injected rats containing ACB and HIP at pre- and post-nicotine injection.