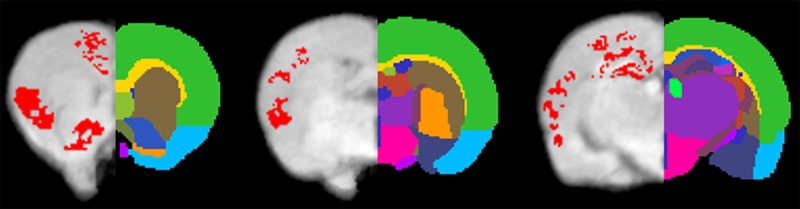
Figure 5.
Statistical comparison of MEMRI enhancement between controls and rats with chronic nicotine exposure. Pixels with significantly increased enhancement (P < 0.05) caused by nicotine infusion superimposed on brain anatomy. Brain regions were labeled using different colors on the right hemisphere. Brain regions: Mark 1 Isocortex; Mark 2 Striatum; Mark 3 Nucleus accumbens; Mark 4 Preoptic area; Mark 5 Corpus callosum; Mark 6 Thalamus; Mark 7 Dentate gyrus; Mark 8 Hypothalamus; Mark 9 Pallidum; Mark 10 Amygdala; Mark 11 CA1 of hippocampus; Mark 12 CA3 of hippocampus; Mark 13 Fimbria fornix.