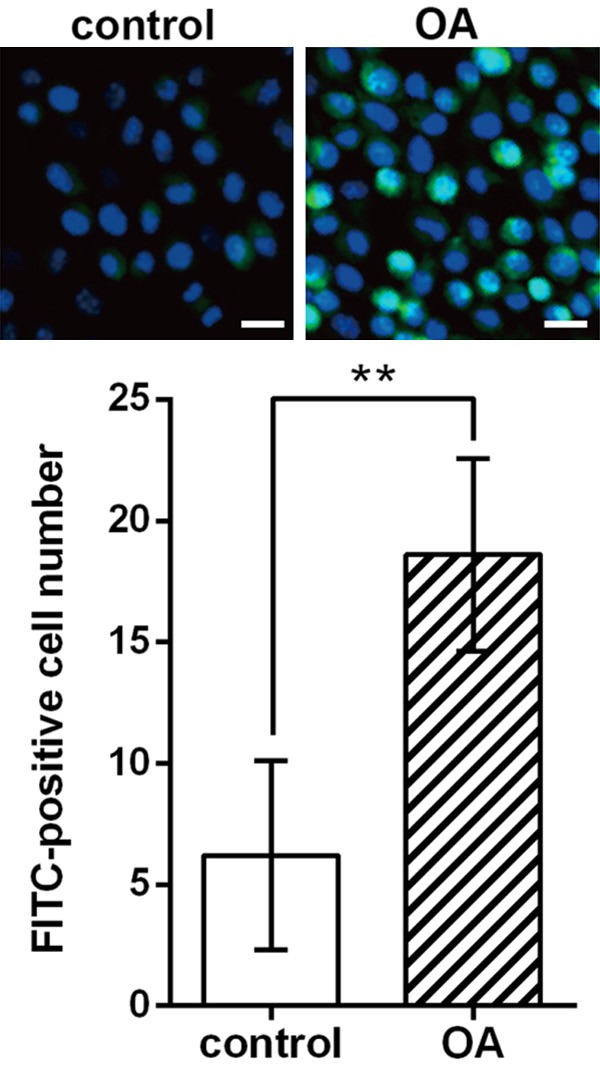
Figure 1.

Apoptotic chondrocytes (blue-green) in cartilage sections of OA patients and non-OA patients (control) using TUNEL assay and the significant difference in apoptotic cell (FITC-positive) number between the two groups. The experiments are repeated five times. Bar indicates 20 μm. The nuclei are stained by DAPI (blue). **P < 0.01. OA, osteoarthritis. FITC, fluorescein isothiocyanate.
