
Figure 8.
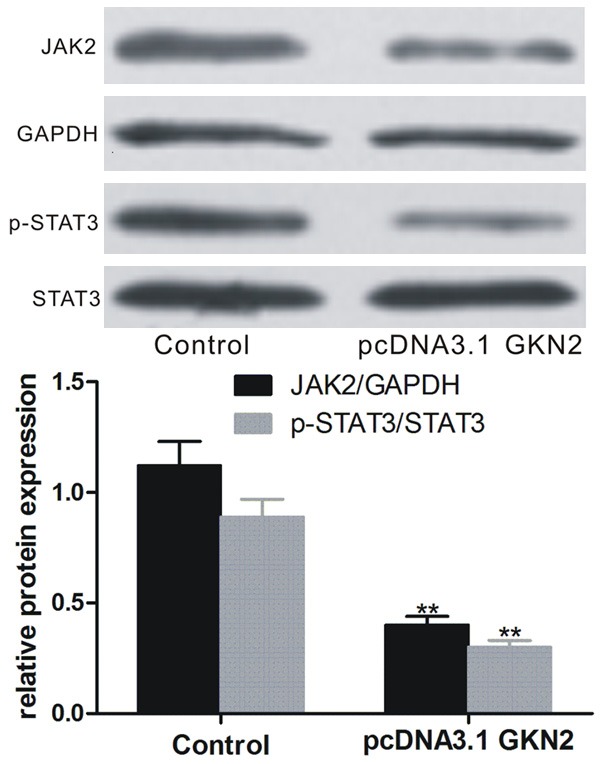
Expression of JAK2 and pSTST3 in SGC-7901 cells after transfection with pcDNA3.1-GKN2 and control. Upper pane: Western blot; lower pane: relative protein level. **denotes P < 0.01 vs control-transfected SGC-7901 cells.
Official websites use .gov
A
.gov website belongs to an official
government organization in the United States.
Secure .gov websites use HTTPS
A lock (
) or https:// means you've safely
connected to the .gov website. Share sensitive
information only on official, secure websites.
Expression of JAK2 and pSTST3 in SGC-7901 cells after transfection with pcDNA3.1-GKN2 and control. Upper pane: Western blot; lower pane: relative protein level. **denotes P < 0.01 vs control-transfected SGC-7901 cells.