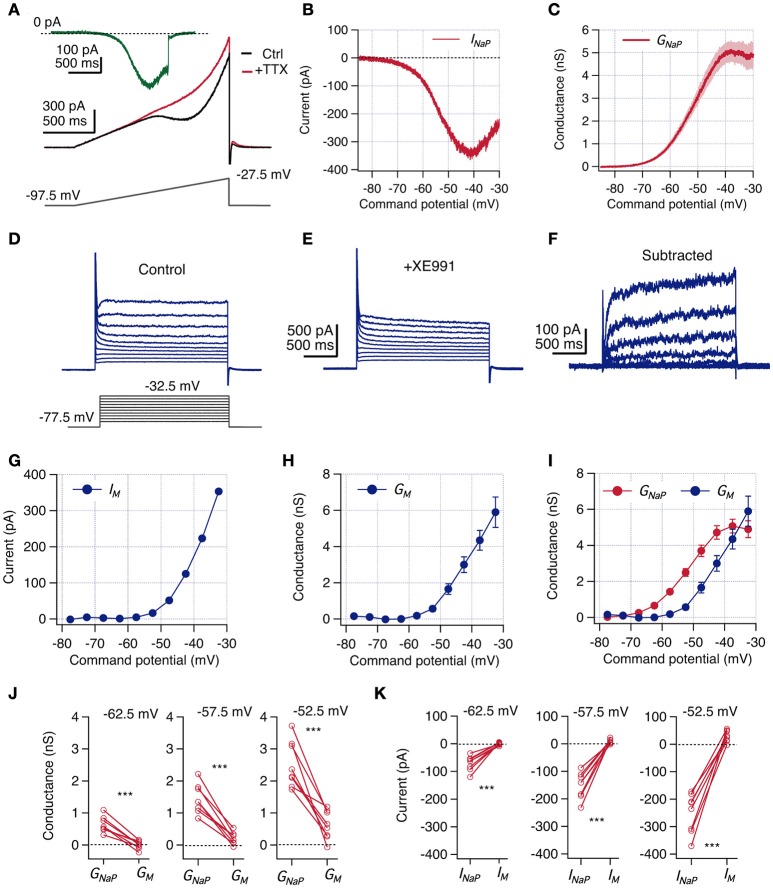
Figure 4.
INaP magnitude is larger than IM at perithreshold potentials. Voltage clamp experiments were designed to measure INaP and IM consecutively in the same CA1 neurons. (A) A voltage ramp protocol was used to isolate INaP by a subtraction method. The slow depolarizing ramp (46.6 mV/s) inactivates transient Na+ current in control condition (black) but allows the induction of the persistent current. After addition of 1 μM TTX INaP is blocked (red). Isolated INaP trace is obtained by subtraction of these two recordings (green trace). (B) Representative whole-cell INaP vs. command potential curve. (C) Average GNaP vs. command potential curve calculated from whole-cell currents curves divided by the driving force (Vm-ENa, n = 13). (D,E) Protocol used to measure IM. Neurons were held at −87.5 mV and a family of 2 s depolarizing squared voltage pulses were used to explore potentials between −77.5 and −32.5 with 5 mV steps, at control conditions (D) and after bath addition of 10 μM of XE991 (E). (F) IM traces are isolated by subtracting recordings in XE991 from those in control condition. (G) Representative whole-cell IM vs. command potential obtained from (F) (current was measured as the average of the last 50 ms of the pulse response). (H) Average GM vs. command potential curve (n = 13). Individual conductance curves were obtained dividing IM by Vm-EK. (I) Overlap of GNaP and GM curves shown in C and H, respectively. Continue GNaP curve was quantized extracting values at same potentials explored for GM. (J) Paired comparison of GNaP and GM obtained at three near threshold potentials (n = 8). (K) Paired comparison of INaP and IM calculated using reversal potentials from current clamp condition (n = 8). Two-way repeated measures ANOVA, ***P < 0.001.

