Figure 5.
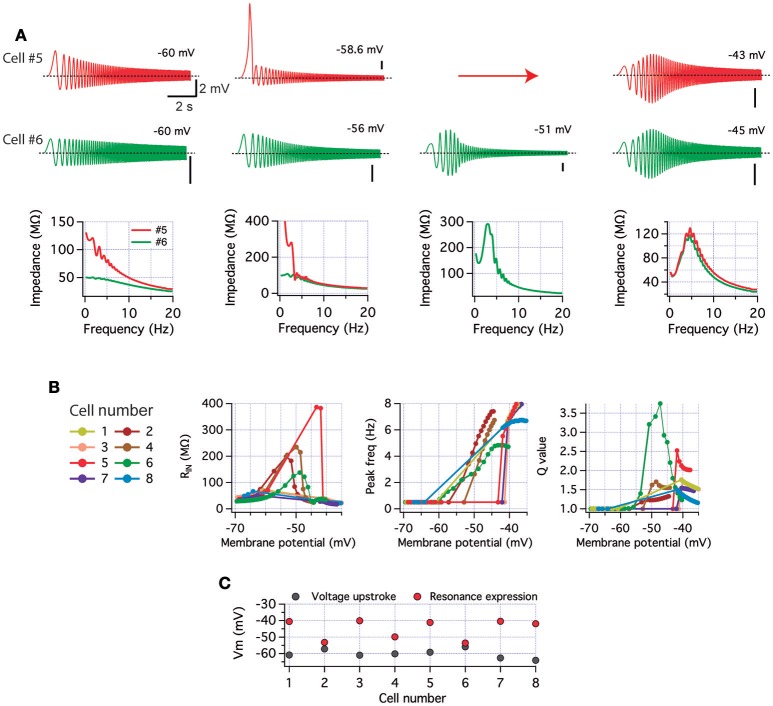
Experimentally measured levels of INaP and IM reproduce perithreshold variability in a model of CA1 pyramidal neuron. Computer simulations of cell excitability were performed using a conductance-based model to explore perithreshold dynamics with the values for INaP and IM measured in voltage-clamp conditions (Figure 4). The model did not include Hodgkin and Huxley conductances (see Section Methods), thus spikes are absent. (A) Voltage response (top) and impedance profile (bottom) of two cells at different depolarized potentials (the arrow indicates a discontinuity in the accessible voltages, see main text). Cells present different non-resonant or resonant properties depending on potential (see text). Calibration bars are 2 mV and 2 s. (B) Summary of input resistance, peak frequency, and Q value from all simulated neurons as a function of holding membrane potential (from −70 to −35 mV). (C) Membrane potential values for INaP-driven upstroke (gray) and for the emergence of resonance (red) in each cell.

