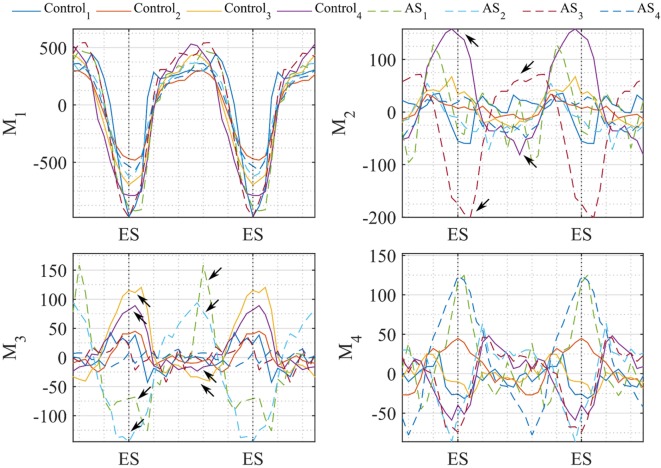
Figure 14.
Coefficients of the motion vector plotted against time (2 cardiac cycles are herein represented). Each line represents one subject, i.e., Control subjects are plotted in continuous line and AS in dashed line. Temporal variation of the coefficients resulting from our motion analysis is plotted for the first 4 modes. Arrows highlight the values where coefficients differ mostly between control-AS subjects comparison.

