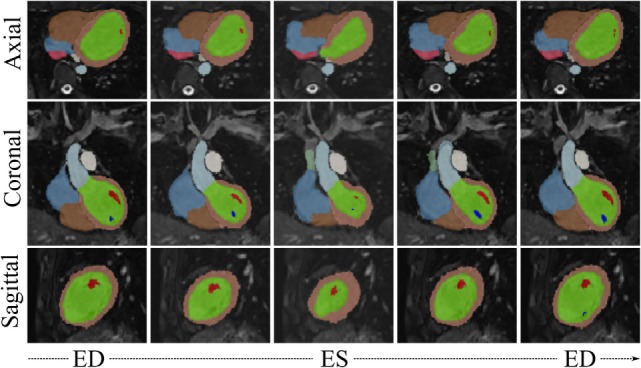
Figure 7.

WHSyn,jt with overlaid automatic segmentation from 5 evenly spaced frames of the cardiac cycle of the subject j = Control2. Color code for main segmented structures: lemon-green, LV blood pool; orange, LV myocardium; red and dark blue, papillary muscles; light blue, aorta; brown, right ventricle; azure, right atrium; green, superior vena cava; pink, inferior vena cava; white, pulmonary trunk.
