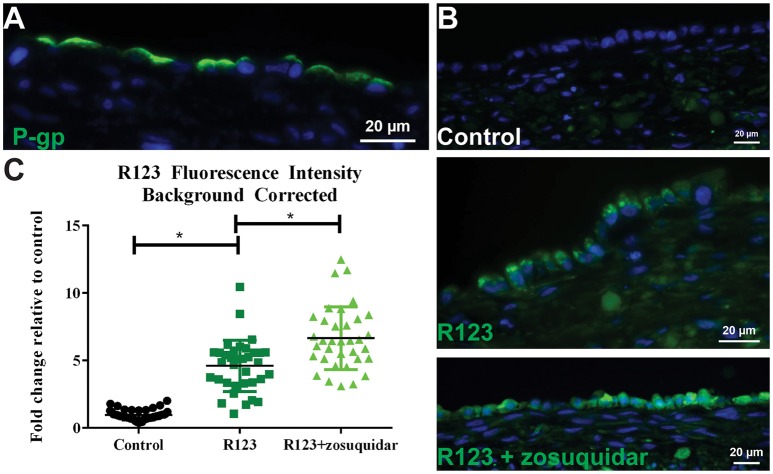
Figure 6.
P-gp transporter localization and function. (A) After 14 days in culture, 3D PT tissues were stained with antibodies against P-gp (green). (B) Tissues were exposed to 5 μM zosuquidar alone, 10 μM rhodamine 123, or rhodamine 123 + zosuquidar for 2 h. Tissues were snap fixed, cryosectioned, and all tissues were imaged at the same exposure time. (C) Fluorescence intensity was quantified in Image J. Data shown represents the mean of duplicate measurements from at least 6 independent tissue samples plus or minus the standard error of the mean. *p < 0.0001 between the groups as compared by one-way ANOVA.

