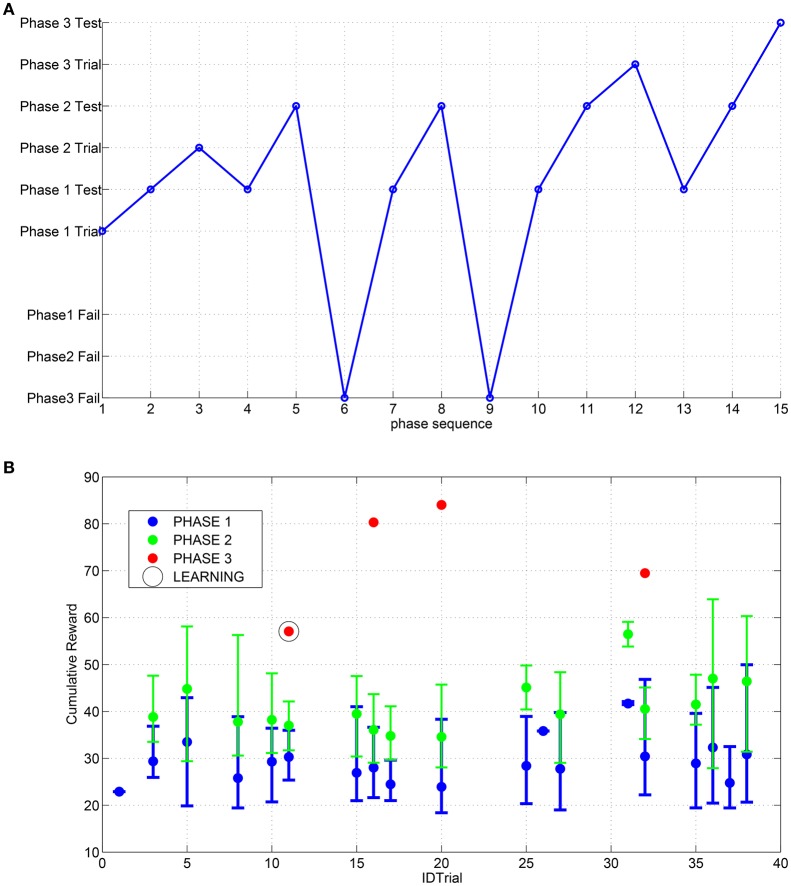
Figure 9.
(A) Sequence of events obtained during the searching process for the suitable parameters through the RFG. (B) Distribution of the cumulative reward for each trial; the error bars indicate the range of excursion between min and max value and the marker corresponds to the mean value. The learning of the SNN is performed only for the IDTrial 11 that is the same as reported in (A) because in the other success event for the third step there are no improvements for the cumulative reward.

