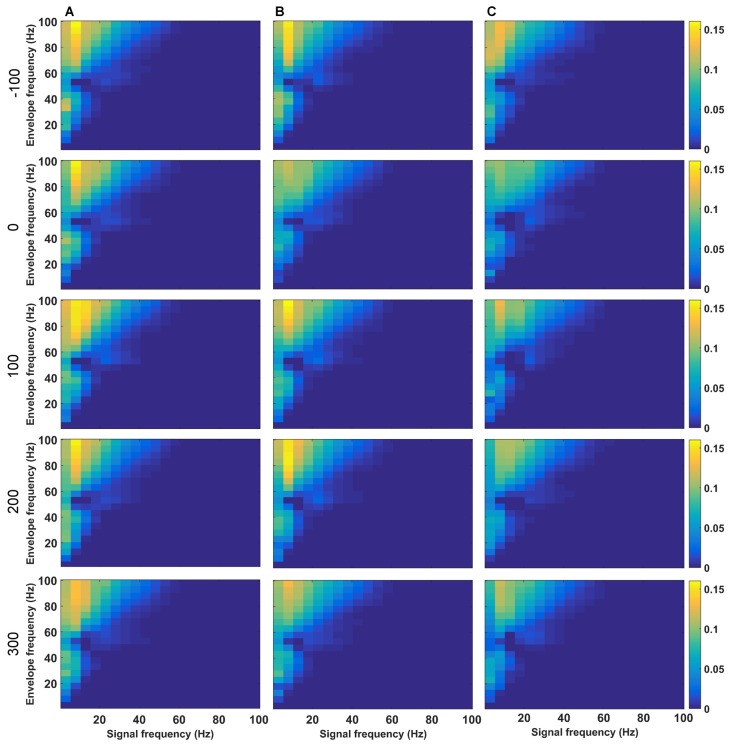
Figure 5.
Phase-to-amplitude coupling (PAC) is altered during, but not after HFS as a consequence of MK801-treatment. (A–C) Changes in theta coupling as a result of HFS was assessed by determining the PAC-ESC scores in the absence of MK801 (A), and 1 (B) or 4 weeks (C) after MK801-treatment. Examples show (top-to-bottom) scores obtained pre-HFS (t = −100 s), during HFS (t = 0), 100 s after HFS, 200 s after HFS and 300 s after HFS. The raw EEG was binned into center frequencies in the range of 3–98 Hz ± 2 Hz resulting in 20 bins in increments of 5 Hz. The y-axis reflects the envelopes of the binned signal whereas the x-axis reflects the frequencies of the signal amplitudes. The PAC-ESC scores, resulting from a comparison of envelopes and amplitudes at the binned frequencies, are expresses on the color scale for each separate plot. The probability that envelopes of a fast signal match to the shape of amplitudes from slower signals is higher. For this reason the highest PAC-ESC scores are observed at the top left of each single plot. This relationship remains stable for all test-conditions (A–C) and time-points. The PAC-ESC scores for frequencies in the range of theta to beta, as well as high gamma oscillation remain high during all time-points and conditions, with the exception of t = 0 (during HFS), whereby lower PAC-ESC scores are evident 1 and 4 weeks after MK801-treatment, compared to the control condition.

