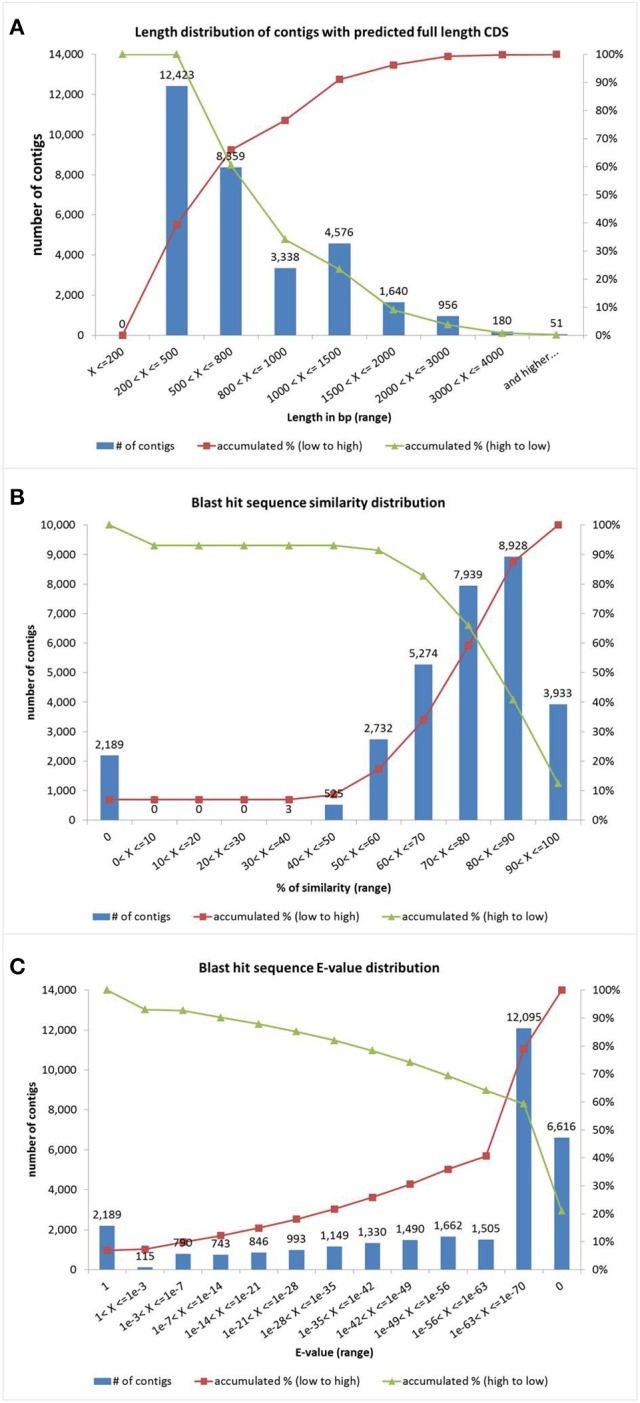
Figure 2.

Identity analysis of quinoa genes. (A) Contig size distribution (bp). (B) Blast hit sequence similarity distribution. (C) Blast hit sequence E-value distribution. Red line represents the accumulation rate from low value to high whereas green line represents the accumulation ratio from high value to low.
