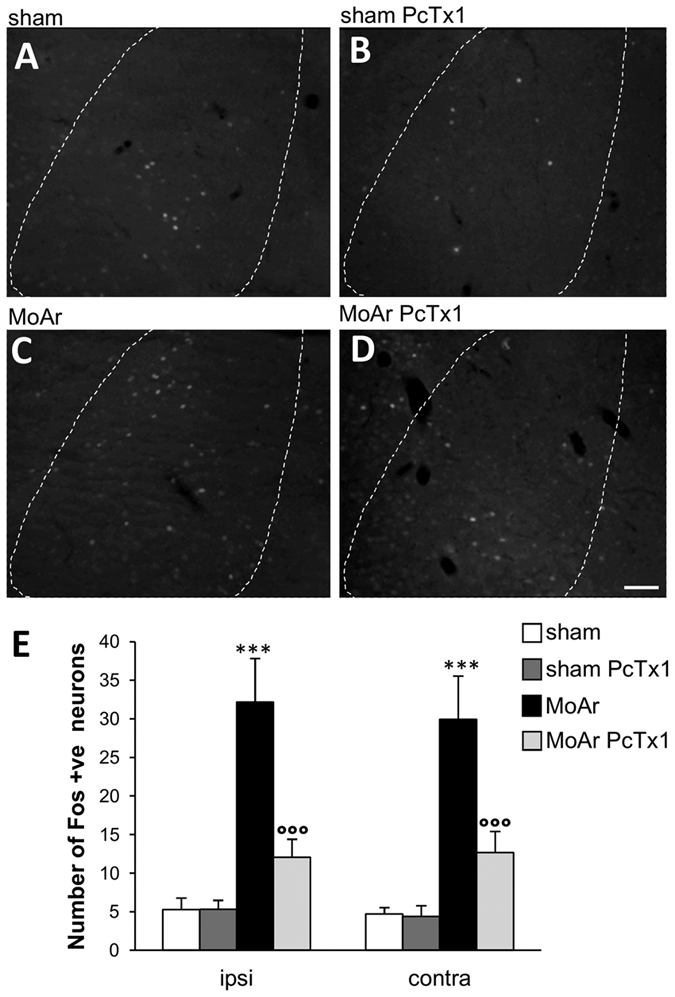
Figure 3.

Representative photomicrographs of monoarthritis-induced upregulation of c-Fos expression in the contralateral BLA of sham pre-treated with saline (A) or PcTx1 (B), and MoAr pre-treated with saline (C) or PcTx1 (D). Scale bars = 100 μm. (E) Quantification of c-Fos-positive cells per section in the BLA of sham or MoAr rats as shown in (A–D) n = 5 animals/group (6–8 sections) for each group. One-way ANOVA followed by a Tuckey post hoc test. ***p ≤ 0.001 compared to sham group, °°°p ≤ 0.001 compared to Moar saline group.
